Tip # 1504 – Using dynaMACS GlobalView to see your top relationships
Overview
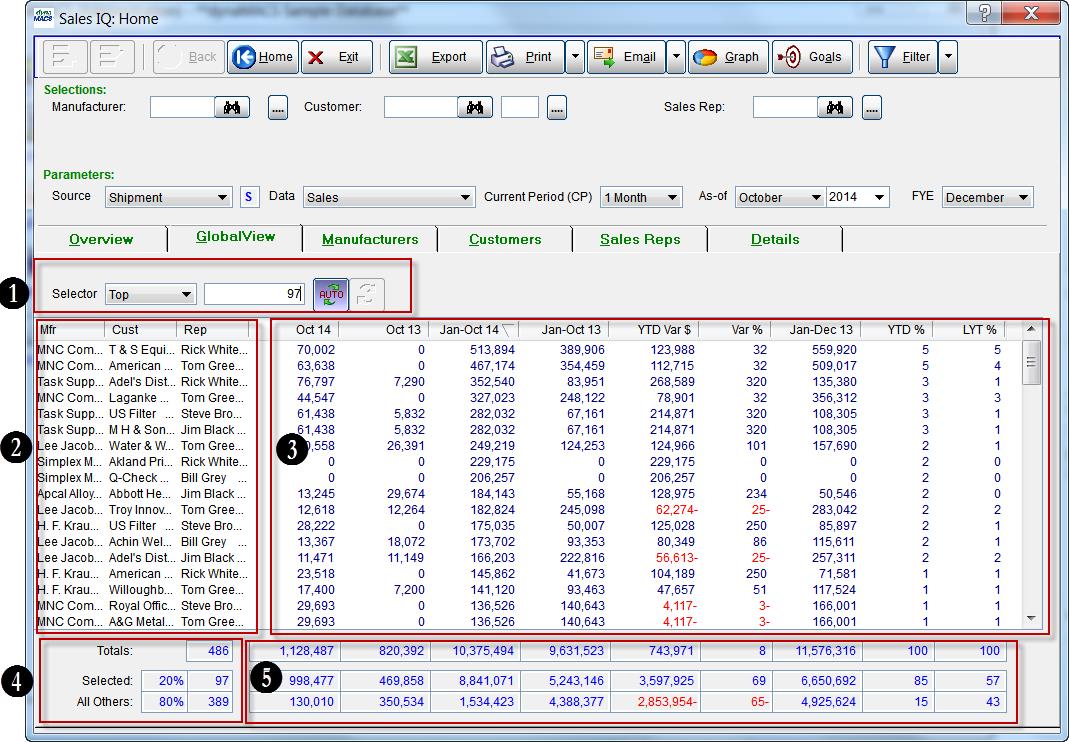
GlobalView is a new analytical concept developed by dynaMACS and is unique to dynaMACS Software. Users now have the ability to view all Customer/Manufacturer relationships on a single screen. Prior to this unique feature, users had to drill down from either Customers or Manufacturers to see these records. Now users can easily and quickly slice and dice these Customer/Manufacturer relationship records on a single screen enabling them to analyze where they are up or down.
Features of the GlobalView Screen
When selecting the GlobalView tab dynaMACS will automatically display the “Top” 20% of the customer/manufacturer records based on the user default sort column.
Selector Section
The Selector Section is used to determine what records to display in the GlobalView list. The selector options are described below.
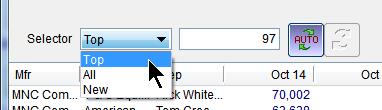
Top = This is the default option when first displaying the GlobalView tab and by default the top 20% of all records will be displayed. This number may be overridden. For example, if you want the top 10 customer/manufacturer relationships to be displayed, enter “10” in the field next to the Selector field.
All = As the name implies, all records will be displayed when this option is selected.
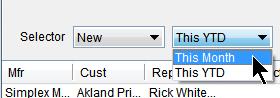
New = When selecting New you have the option to see new This Month or new This YTD.
AutoRefresh is on when the auto button appears purple in color. Sorting on a column will reload the records based on the selection criteria for that column. AutoRefresh is off when the auto button appears grey in color. Sorting on a column will sort the existing records on the values in that column.
Refresh button will reload based on the selection criteria for the sorted column.
Relationship Names
The performance data is stored in dynaMACS by Manufacturer/Customer/Sales Rep. In GlobalView, the names for these entities are displayed on each row of the list.
Performance Values
The performance values shown in GlobalView are consistent with the other views in Sales IQ.
Totals (Record Count)
Totals = This number represents the total number of records in the database. If a filter is used, this number will reflect the number of records in the filtered database.
Selected = Based on the selection criteria used at the top of the list, this will show the number of selected records. To the left of the record count is the percent value for the selected records as a percent of the total records.
All Others = Based on the selection criteria used at the top of the list, this will show the number of records “not selected”. To the left of the record count is the percent value for the not selected records as a percent of the total records.
Totals (Performance Values)
Totals = The performance values totals shown in GlobalView are consistent with the other view in Sales IQ.
Selected = These totals represent the performance value totals based on the selection criteria used at the top of the list.
All Others=These totals represent the performance value totals based on the selection criteria used at the top of the list for records “not selected”.