Case Study: BNT Sales Agency Limited
“Before buying software, I did my homework. For every question or need I had, dynaMACS had a solution.”
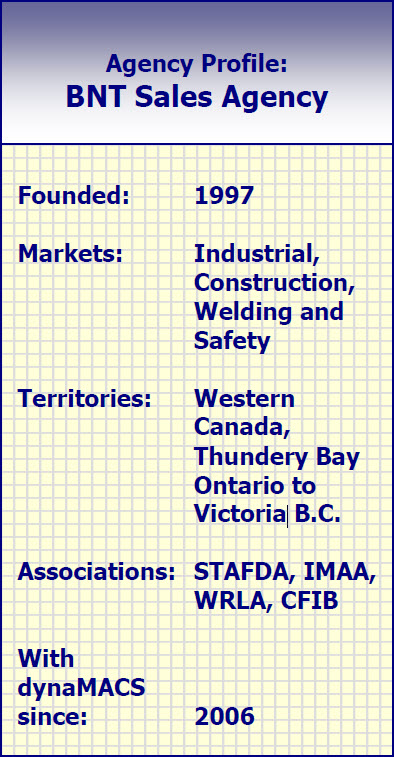
Wade Wohlford, President / Welding Specialist
BNT Sales Agency
 Client Challenge
Spreadsheets used to be the rudimentary but necessary tool for BNT Sales Agency to track agency performance. The utilitarian process was time-consuming and limiting, showing only basic information. BNT needed more: the ability to see in-depth, organized sales and commission information.
When Wade Wohlford, President of BNT Sales Agency, saw a demonstration of dynaMACS at a trade show, he saw a world of opportunity; a wealth of sales and commission data at his disposal anytime – and the ability to see the agency in ways never before possible.
 dynaMACS Solutions
“I did my homework, comparing various brands of software. For every question or need I had, dynaMACS had a solution,” Wohlford says.
dynaMACS combines sales and commission information for all manufacturers, customers and sales reps in one database. Sortable, filterable data enables Wohlford and his team to see exactly the information they need, in the ways they want to see it.
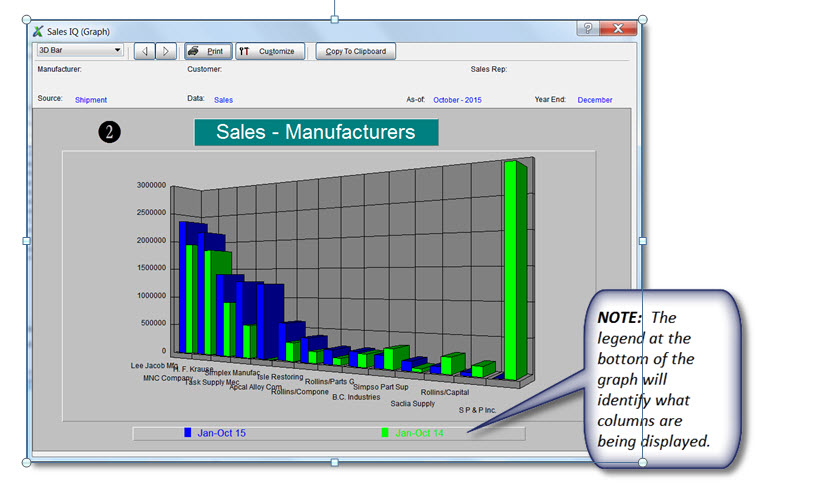
With the ability to view data, sorted by manufacturer, customer or sales rep – and much more, “I can look at a quick snapshot of customer and manufacturer numbers, or analyze in-depth data,” he says. Wohlford sees which territories are up or down, “We can identify which product lines to focus on.”
Wohlford says he also looks at year-over-year data, comparing this year to last for a full understanding of agency performance.
When it comes to analyzing sales, paying reps and tracking commissions, dynaMACS went beyond meeting BNT Sales Agency’s individual and specific needs. It changed the way agency operates.