Generate sales & commission reports in seconds
Convert raw data into meaningful information with the click of a mouse. Produce summary and/or detailed reports, and choose from pre-defined formats and customizable options.
Reporting as easy as 1 – 2 – 3
1. Select the report format
dynaMACS offers over 25 pre-defined formats.
2. Select the report sequence
Sort based on one or more of the following:
- Customer
- Branch
- Customer class
- Customer division
- Sales rep
- Customer type
- Parent manufacturer
- Buying group
- State/region
- Manufacturer
- Mfg. type
- X-Ref Source
3. Customize the report
- Include/exclude records based on the values of the fields.
- Sequence to focus on the most important records – those with the highest volume of sales or commission dollars.
- Base reports on any fiscal year or go back to a prior month.
- Replace Current Month amounts with variable number of months. May be used for Quarterly analysis.
The examples below show some common questions dynaMACS reports provide the answers to:
“Can I rank all manufacturers based on commissions generated year-to-date?”
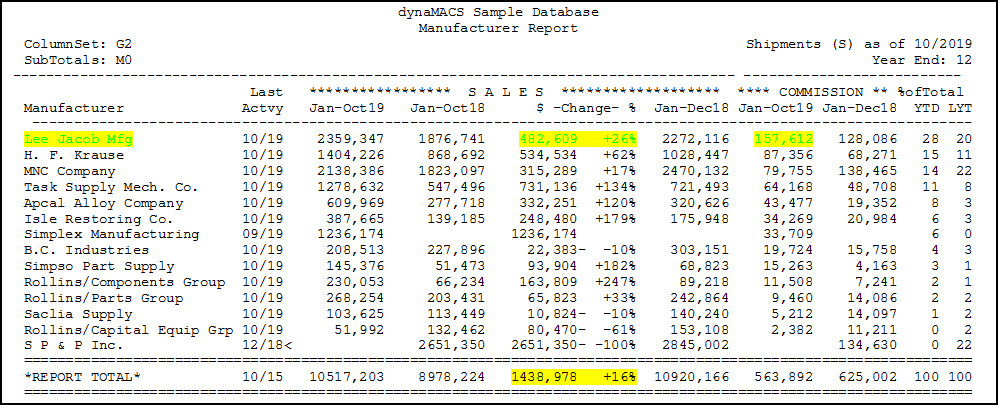
All of the agency’s manufacturers are ranked, in descending order. Lee Jacob Mfg has generated $157,612 in commissions and we are ahead $482,609 or 26% based on sales volume this year-to-date. Agency sales are up $1,438,978 or 16% for all manufacturers represented.
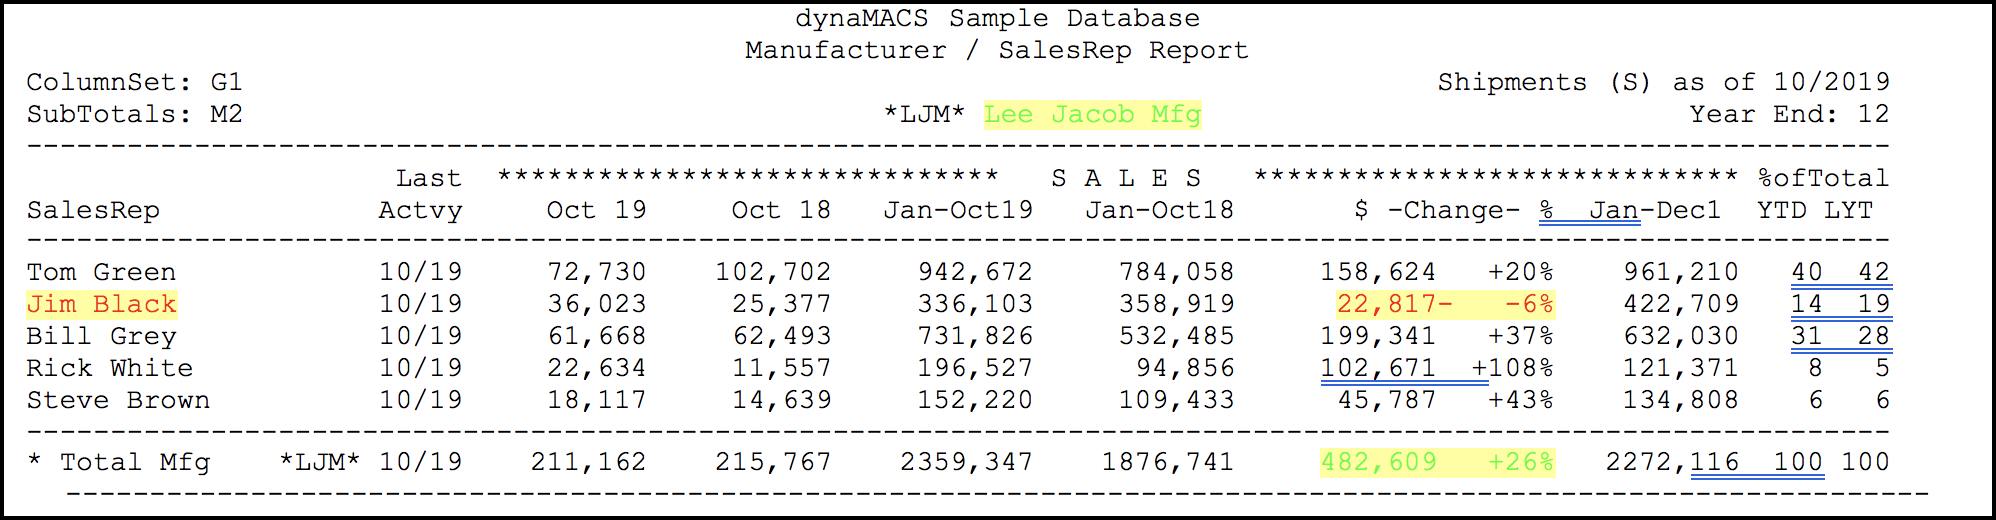
“How is each sales rep performing for a particular manufacturer?”
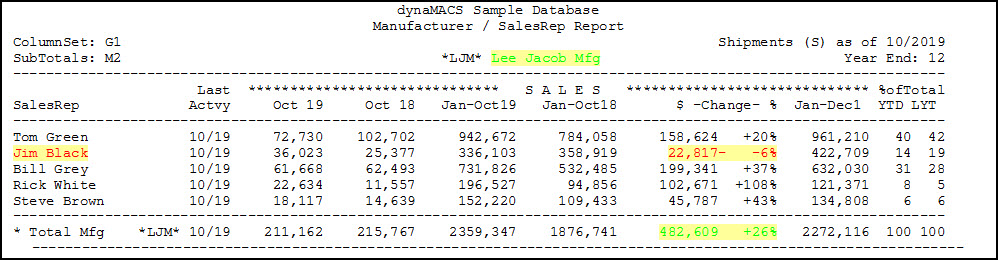
For Lee Jacob Mfg, all sales reps are up except Jim Black, who is down $22,817 or -6%.
“Can I review the customers for a specific manufacturer for each sales rep?”
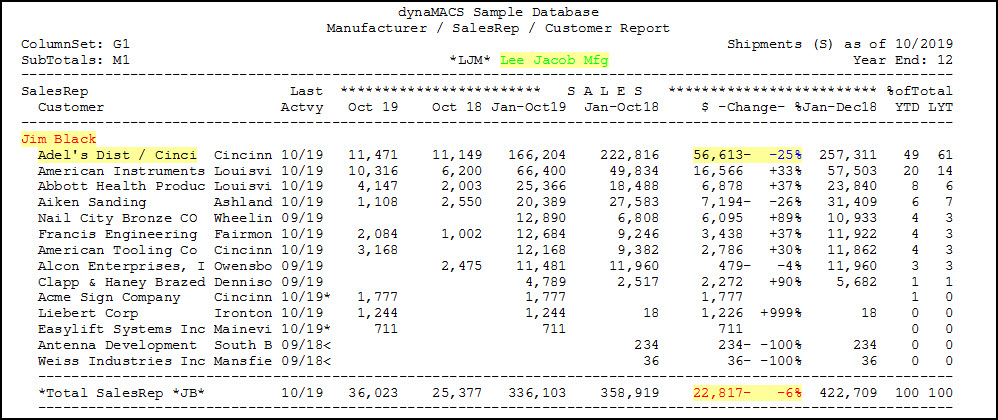
All customers Jim Black sells to for Lee Jacob Mfg are shown. Adel’s Distributing is down $56,613, or 25%. Overall, Jim Black’s customers for Lee Jacob are down $22,817, or 6%.
“How are my manufacturers performing by type of customer?”
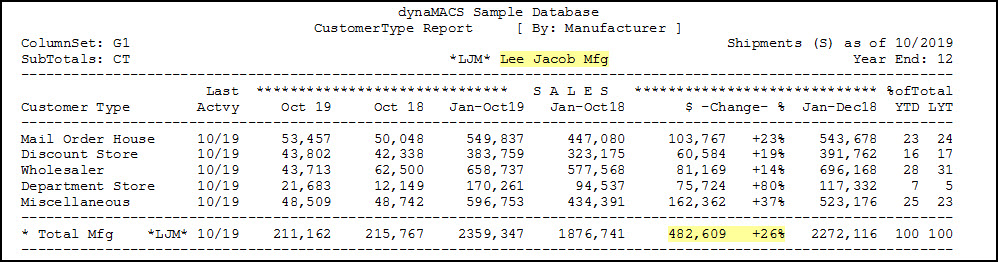
Lee Jacobs Mfg is up 26% or $482,609, versus last year. Sales are up with all types of customers.
“How is each of my sales reps performing overall?”
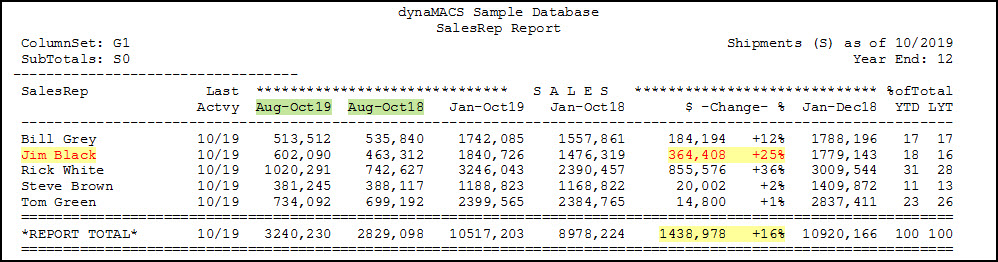
All sales reps are listed, including their total sales for the current 3 month period and current year-to-date, versus last year’s same 3 month period and year-to-date. Jim Black is up 25% for the year, or $364,408.
“How is one of my sales reps performing for all manufacturers we represent?”
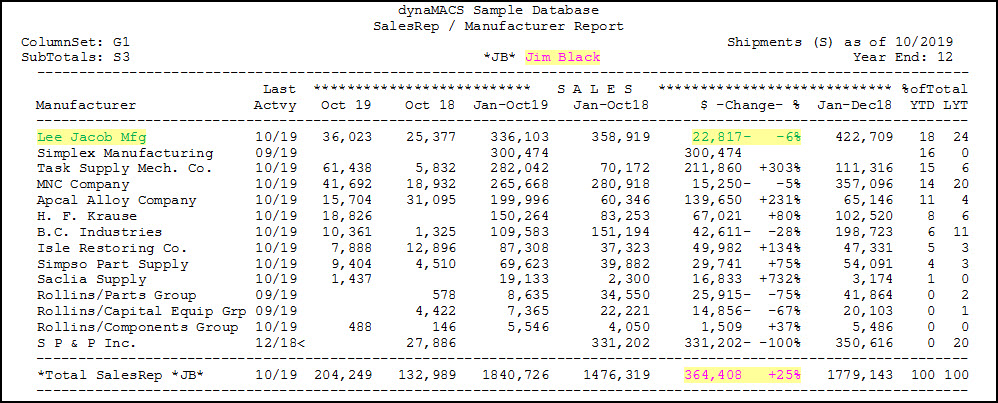
Jim Black’s manufacturers are listed in descending order of total sales. For the year, Jim sold the most for Lee Jacob Mfg., but his sales for Lee Jacob are down $22,817 or 6% from last year. Total yearly sales are up 25% to 364,408.
“Can I see a report showing all manufacturers a customer buys from?”
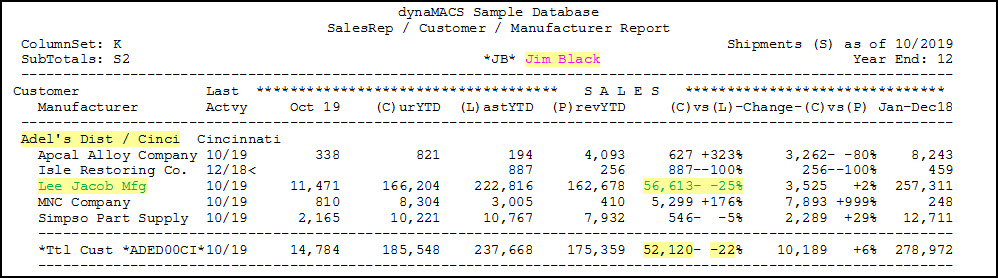
Adel’s Distributing/Cincinnati buys from five manufacturers. They are down 25% or $56,613 with Lee Jacobs. Overall, they are down 22% or $52,120.
“Can I see a ranking of customers within a particular sales rep’s territory?”
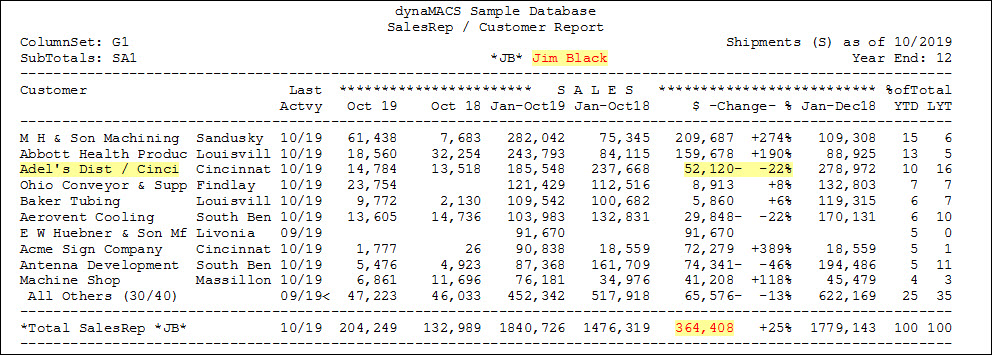
Customers in Jim Black’s territory are listed in descending order of current sales. For Adel’s Distributing/Cinci, the customer is down 22% or $52,120 over last year. Jim’s total increase for all customers in the territory is $364,408.
“Can I see an analysis of sales/commissions by state or region?”
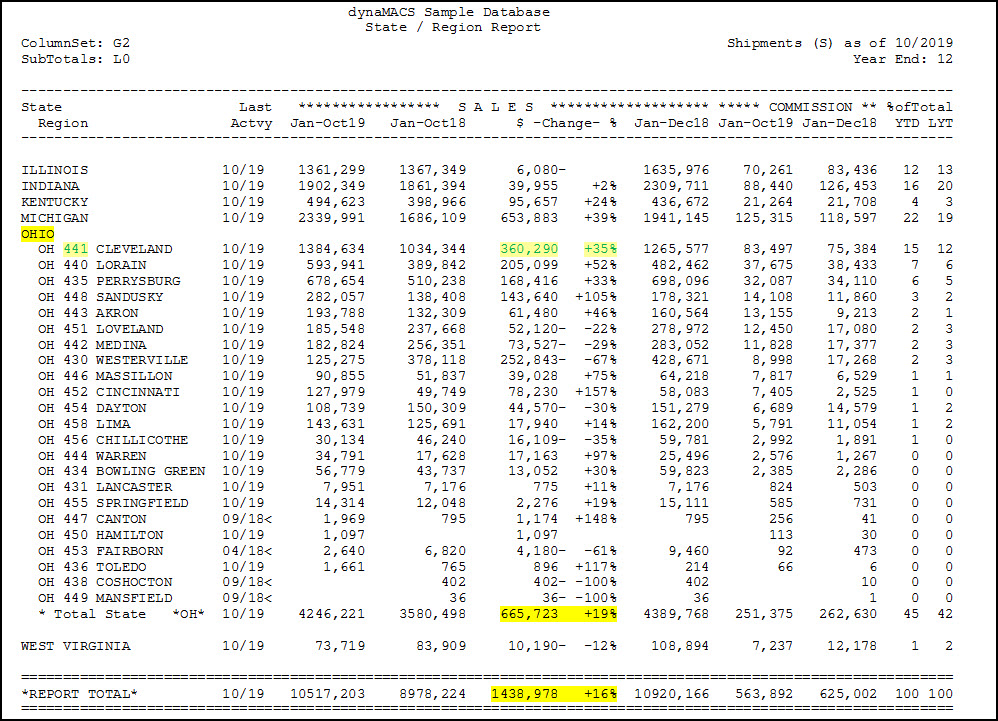
For the state of Ohio, the agency is up $665,723 or 19%. For a portion of that state, zip code 441, the agency is up $360,290 or 35%. Overall, the agency’s sales are up $1,438,978 or 16%.