
Page 13 - Information_Kit
P. 13
Software Overview, continued
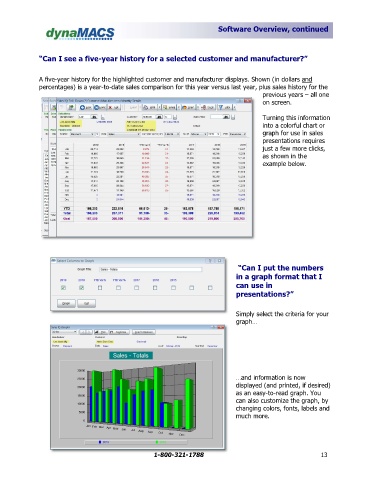
“Can I see a five-year history for a selected customer and manufacturer?”
A five-year history for the highlighted customer and manufacturer displays. Shown (in dollars and
percentages) is a year-to-date sales comparison for this year versus last year, plus sales history for the
previous years – all one
on screen.
Turning this information
into a colorful chart or
graph for use in sales
presentations requires
just a few more clicks,
as shown in the
example below.
“Can I put the numbers
in a graph format that I
can use in
presentations?”
Simply select the criteria for your
graph…
…and information is now
displayed (and printed, if desired)
as an easy-to-read graph. You
can also customize the graph, by
changing colors, fonts, labels and
much more.
1-800-321-1788 13