dynaMACS Software Overview Demo

Case Study: The Henson Sales Group, Ltd.

 “dynaMACS is sophisticated. It creates operational efficiencies and delivers extremely detailed data.”

Alicia Bucci, Office/Operations Manager
Henson Sales Group Ltd.

HensonSalesGrp_LogoClient Challenge

Henson Sales Group was spending too much time on manual tasks related to sales and commissions data. Many of the agency’s factories pay on Trace (point of sale) reports but the old software had limited capabilities and captured only basic data. The agency needed more: more efficiency, more access and more detailed data, explains Office and Operations Manager Alicia Bucci. It was also important that everyone in the organization have access to current information.

HensonSalesGrp_StatisticsdynaMACS Solution

dynaMACS was implemented on the cloud, which gives everyone access to real-time data anytime, anywhere from most smart devices. When Henson Sales Group began using dynaMACS, the agency noticed extremely advantageous improvements:

*The agency can drill down for details – in hundreds of ways – covering all facets of sales and commission. For example: View customers in a sales rep’s territory ranked in descending order by year-to-date sales. Or, a few clicks deliver a 5-year sales history for any manufacturer or customer.

*Manual data entry tasks that used to take hours are completed in seconds, with a few quick clicks using dynaMACS eSi.

*With dynaMACS Mobile, sales reps have access to the most up-to-date data from any Internet-enabled device.

*Sales reps slice and dice information in the ways that are most useful to them for evaluating their territory.

*Customer meetings are more engaging and productive. Sales reps share reports on lines that are down, and by how much.

*Sales reps are able to see complete details for their territory, but unable to see numbers for other territories.

*To assist with compensation, dynaMACS automatically splits commissions among sales reps.

dynaMACS delivered Henson Sales the functionality needed for efficiency and access to comprehensive data.

Tip #1508 – Did you know about this Simple Way to Get Quarterly Sales Numbers in dynaMACS?

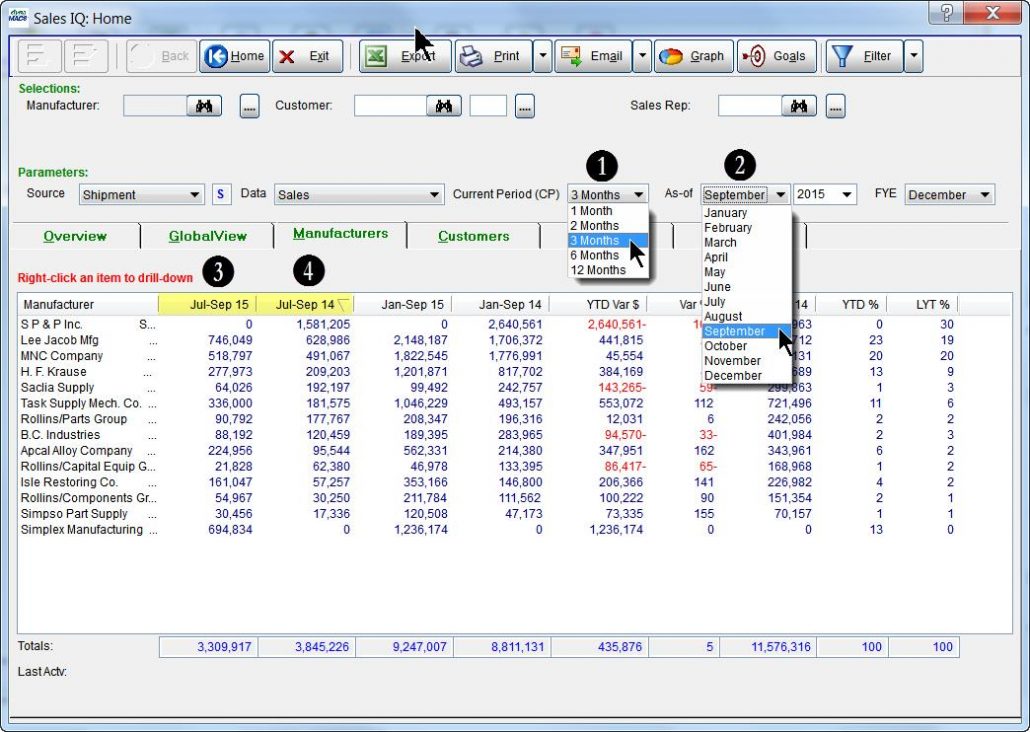
This tip will demonstrate a very simple and quick way to get your quarterly sales numbers by using the dynaMACS Sales IQ feature.

In the following example we will show the last three months of sales data for all manufacturers.

  1.  With the Manufacturers tab selected in the Sales IQ screen, choose 3 Months in the Current Period (CP) drop down list in the Parameters section.
  2. Select September 2015 in the As-of drop down list.
  3. The first column now displays data for the selected 3 month period of Jul-Sep 15 (current year).
  4. The second column displays data for the selected 3 month period of Jul-Sep 14 (prior year).SIQ Screen

Note

Tip # 1504 – Using dynaMACS GlobalView to see your top relationships

Overview

GlobalView is a new analytical concept developed by dynaMACS and is unique to dynaMACS Software.  Users now have the ability to view all Customer/Manufacturer relationships on a single screen.  Prior to this unique feature, users had to drill down from either Customers or Manufacturers to see these records.  Now users can easily and quickly slice and dice these Customer/Manufacturer relationship records on a single screen enabling them to analyze where they are up or down.

Features of the GlobalView Screen

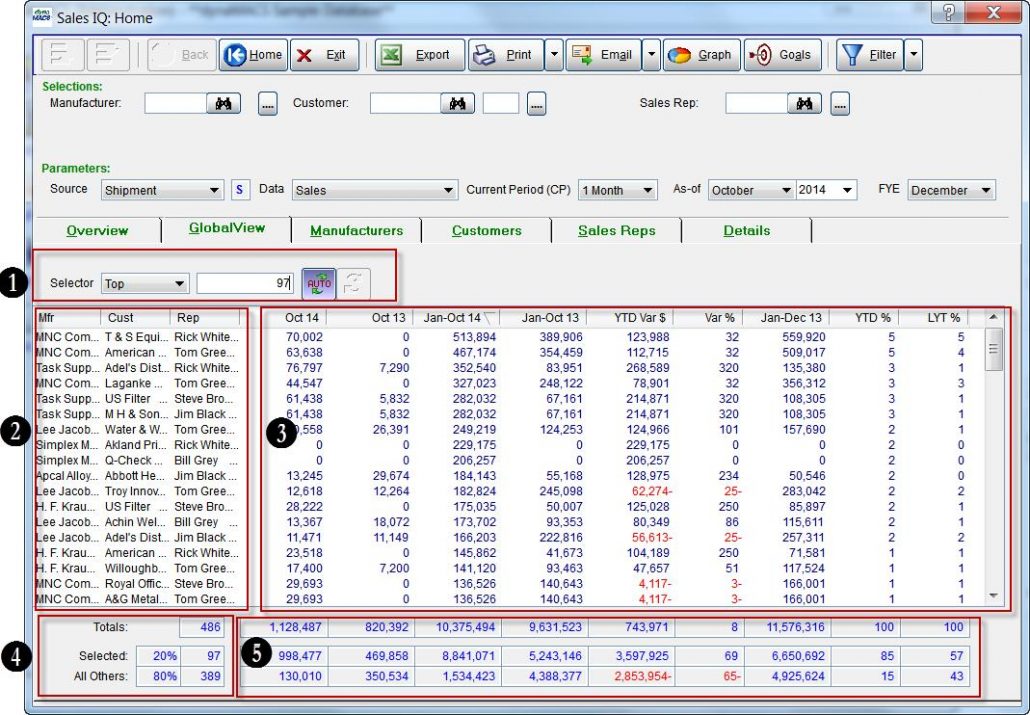
When selecting the GlobalView tab dynaMACS will automatically display the “Top” 20% of the customer/manufacturer records based on the user default sort column.

SIQ Home

Selector Section

The Selector Section is used to determine what records to display in the GlobalView list.  The selector options are described below.

Selector Section 1

Top = This is the default option when first displaying the GlobalView tab and by default the top 20% of all records will be displayed.  This number may be overridden.  For example, if you want the top 10 customer/manufacturer relationships to be displayed, enter “10” in the field next to the Selector field.

All = As the name implies, all records will be displayed when this option is selected.

New = When selecting New you have the option to see new This Month or new This YTD.

Selector Section 2

AutoRefresh  is on when the auto button appears purple in color.  Sorting on a column will reload the records based on the selection criteria for that column.  AutoRefresh is off when the auto button appears grey in color.  Sorting on a column will sort the existing records on the values in that column.

Refresh button will reload based on the selection criteria for the sorted column.

Note

Relationship Names

The performance data is stored in dynaMACS by Manufacturer/Customer/Sales Rep.  In GlobalView, the names for these entities are displayed on each row of the list.

Performance Values

The performance values shown in GlobalView are consistent with the other views in Sales IQ.

Totals (Record Count)

Totals = This number represents the total number of records in the database.  If a filter is used, this number will reflect the number of records in the filtered database.

Selected = Based on the selection criteria used at the top of the list, this will show the number of selected records.  To the left of the record count is the percent value for the selected records as a percent of the total records.

All Others = Based on the selection criteria used at the top of the list, this will show the number of records “not selected”.  To the left of the record count is the percent value for the not selected records as a percent of the total records.

Totals (Performance Values)

Totals = The performance values totals shown in GlobalView are consistent with the other view in Sales IQ.

Selected = These totals represent the performance value totals based on the selection criteria used at the top of the list.

All Others=These totals represent the performance value totals based on the selection criteria used at the top of the list for records “not selected”.

Case Study: C. R. Kinsman & Associates, Inc.

“All of our data is on the cloud, so we never have to worry about losing invaluable sales and commission information.”

Craig Kinsman, CPMR & President
C.R. Kinsman & Associates, Inc.

Client Challenge

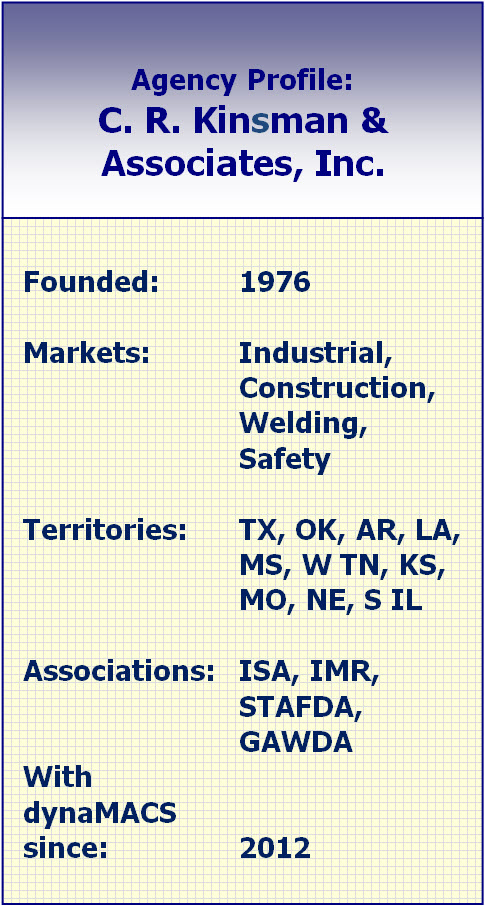
Technology has changed the world since C.R. Kinsman & Associates Inc. (CRK) was founded in 1976. At the time, data was recorded 100% manually on paper. When computers were introduced, the agency was an early adopter. A custom sales and commission software was developed, and at the time it was cutting edge.

But as technology continued to evolve, the software became outdated. “Running reports was labor intensive, data entry was still manual and the reports were archaic.” says Craig Kinsman, CPMR and President. Like so many agencies, CRK continued to use it because “that’s the way it had always been done.”

CRK_StatisticsdynaMACS Solution

As the agency expanded its executive team, it was the perfect time to look into new sales and commission software. “We asked other agencies. dynaMACS was the software of choice,” Kinsman says.

dynaMACS transferred a two-year history of CRK’s data from Microsoft Access system with no loss of information.

The team was apprehensive about the learning curve in using new software, but Kinsman says, “We were shocked at how easy dynaMACS was. We wish we’d gotten it years ago.”

The agency chose to process on the cloud, giving the sales agency access to data anytime, from anywhere. Cloud processing also protects data because all sales and commission data is backed up on the cloud.

The days of archaic reports are ancient history. CRK generates the reports from more than 5,000 choices – or customizes reports for their specific needs. “The possibilities are endless,” Kinsman says. “We can get reports on any aspect of our sales and commission data and overall agency performance.”

With dynaMACS, inefficiency and costly downtime are a thing of the past for CRK.

Case Study: Pepco Sales & Marketing

“dynaMACS saved us tens of thousands of dollars when a manufacturer inadvertently made an error in commissions. We absolutely love the software.”

Charlie Parham, General Manager
Pepco Sales & Marketing

Pepco_Sales_And_Marketing_LogoClient Challenge

Founded in 1965, Pepco Sales & Marketing has established itself as a reputed industry leader. Technology has changed by leaps and bounds since then. When Microsoft Excel first came out, the agency thought it would be a good way for tracking commissions. However, a linear spreadsheet, with no ability to see the sales history, or drill down for more information, was not providing enough flexibility or features to manage the business effectively.

Pepco_Sales_And_Marketing_StatisticsdynaMACS Solution

Pepco selected dynaMACS due to its ease of use and ability to analyze sales and track commissions. “Anyone can hop on dynaMACS and be up and running after a 5-minute training session,” Parham says.

Pepco has a powerful tool for viewing and analyzing data. “There are so many to ways analyze sales and commissions. I look at:

· Sales performance of various manufacturers and salespeople

· What customers are buying from which manufacturers

· How individual salespeople are performing

· Analyze commissions dollars realized per manufacturer

And so much more!”

The software has paid for itself ten times over, by identifying commission errors made by manufacturers. “While running a year-end review of customer purchases from each manufacturer, we noticed a large discrepancy in the actual commissions paid versus the amount tracked by dynaMACS,” Parham explains It turns out a manufacturer had inadvertently made an error that added up to tens of thousands of dollars. “If it weren’t for dynaMACS Commission Tracking we probably would never have found the error.”

Parham’s favorite feature is the ability to get-in depth information with a single mouse click. I can sort by customer, manufacturer or salesperson. “I always know where the sales are coming from. We absolutely love dynaMACS!”