Tip #1211 – Using Data Field in Sales IQ to help analyze sales and commissions. . .
dynaMACS Sales IQ has a unique way of analyzing sales and commissions which allows you to change the data that is displayed in Sales IQ in order to view it several different ways. This tip will show you how to use this data field and also what data fields are displayed for each Data Type option.
Using the Data Type Field
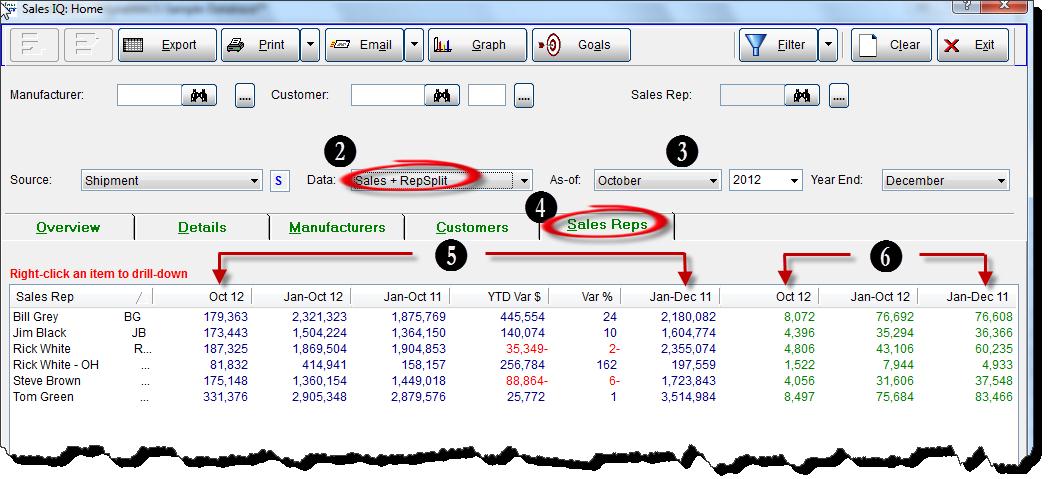
In the following example we show data for Sales and RepSplits listed by sales rep as of October 2012. This allows you to examine sales by each sales rep and what commissions have been paid to each sales rep.
- From the dynaMACS main screen, select the Sales IQ button.
- Select Sales + RepSplits from the Data drop box list.
- Select October from the As-of drop box list.
- Select the Sales Reps tab.
- >The columns in blue represent sales numbers for each sales rep.
- The columns in green represent commissions paid for each sales rep.

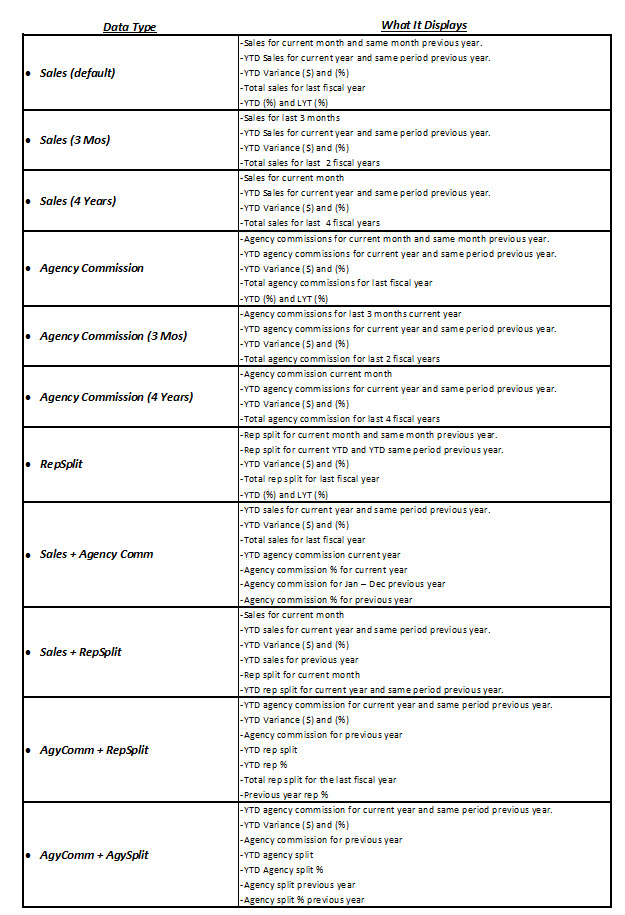
Data Type Descriptions
The following chart explains each Data type available and what will be displayed on the Sales IQ screen when selected.