Posts

Empowering Systems Account Reporter Analytics – POS Reports
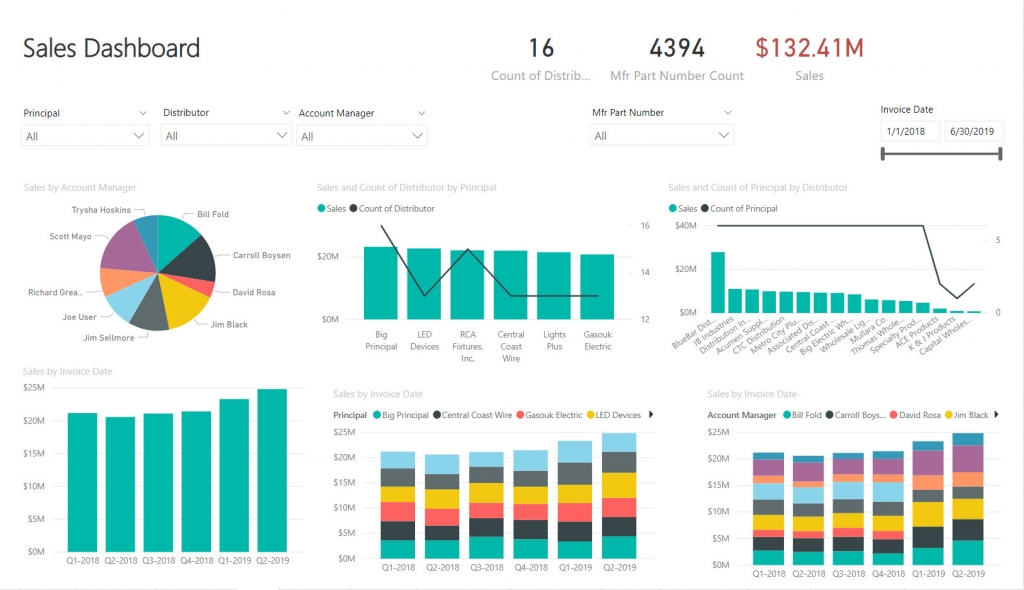
Our advanced sales and commission tracking software enable you to see all the dashboards in AccountReporter Analytics. This analytics is like dynaMACS SalesIQ on steroids. You will be able to see end customer data and part number information if you need that.
With business needs changing all the time. You need to quickly analyze your business and get back to selling. Check out the video below that shows you quickly and easily Point-of-Sale information.
POS Video
Why Do Reps Need Analytics?
You’re probably using CRM. Hopefully, it’s CRM for manufacturers reps, so it’s easy to use and works how you work. Your people are updating opportunities, your managing your commissions but what now? What do you do with all the data you’ve accumulated? How can you use it to show your manufacturers what you’ve sold right down to the product level and what’s in the pipe? Analytics will do all that and more. Take all your data and easily run visual reports showing trends and drop-offs, what products are doing well and who from your firm is selling the most. Techopedia explains Sales Analytics as “the process used to identify, model, understand and predict sales trends and sales results while helping in the understanding of these trends and finding improvement points. … Relevant data is mined and then analyzed in order to forecast future sales.” Learn more from Techopedia here. Sounds good right – but who has the time? Empowering Systems has taken the work out of analytics. As an add-on to AccountManager CRM Empowering Systems developed AccountReporter Analytics with pre-configured dashboards and filtering so you can skip over the work and start learning about your business trends right out of the box.
Want to learn more – Contact April, aslepian@empoweringsystems.com or 800-321-1788 Ext. 720
New dynaMACS Update and Report Enhancements coming in 2020.
We are excited to announce an updated version of dynaMACS that will expedite future updates so we can deliver enhancements to you more quickly.
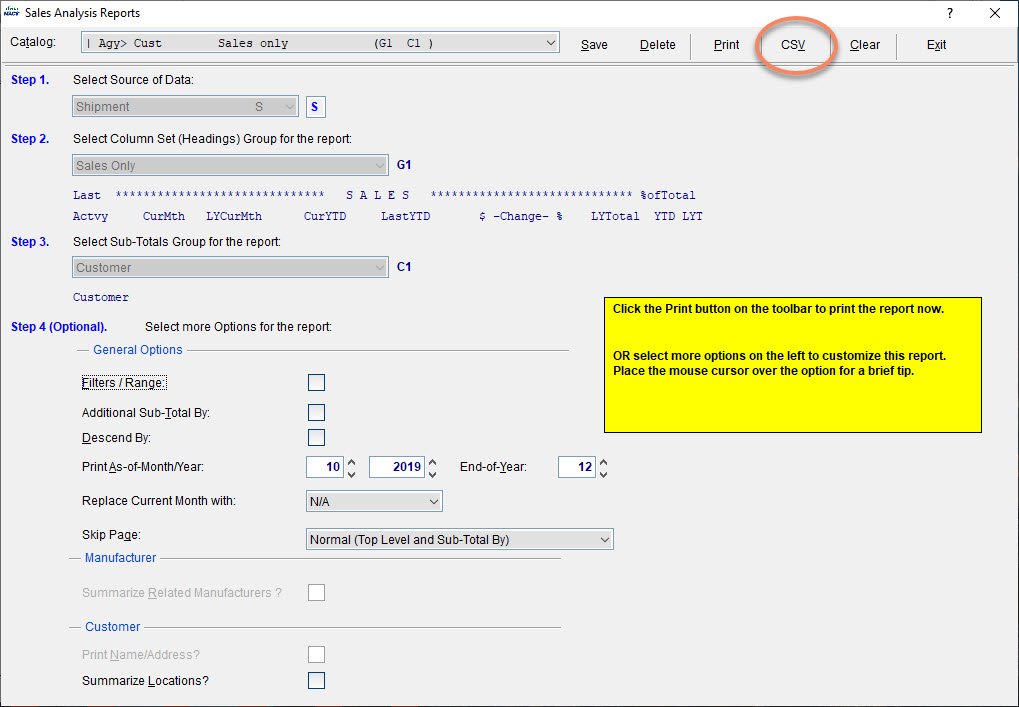
We are working on improving the usability of reporting making them even easier to use and improving the look and feel. With this new update, you will find the ability to do reporting exports. You’ll be able to unlock your sales data by exporting reports from Sales Analysis reporting right into a CSV file and open it in your favorite spreadsheets like Microsoft Excel or Google Sheets with ease. Stay tuned for more updates throughout 2020!!
The release of AccountReporter Analytics by Empowering Systems
Southborough, MA, June 19, 2019 – Empowering Systems, Inc., is pleased to announce the release of AccountReporter Analytics™.
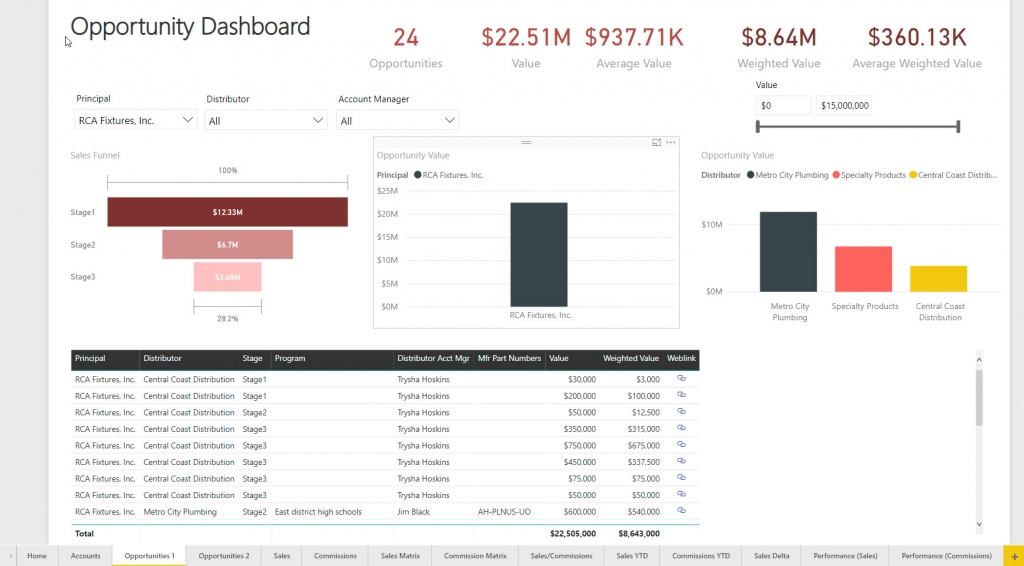
Empowering Systems, a leader in CRM solutions for manufacturers and manufacturers’ representatives since 1994, announces the release of their industry leading AccountReporter Analytics. Powered by Microsoft Power BI® these interactive analytics dashboards reveal opportunity and sales data from AccountManager and SalesAnalysis in ways never before possible. These dashboards give owners valuable business intelligence to measure success, show trends and find the most profitable partners.
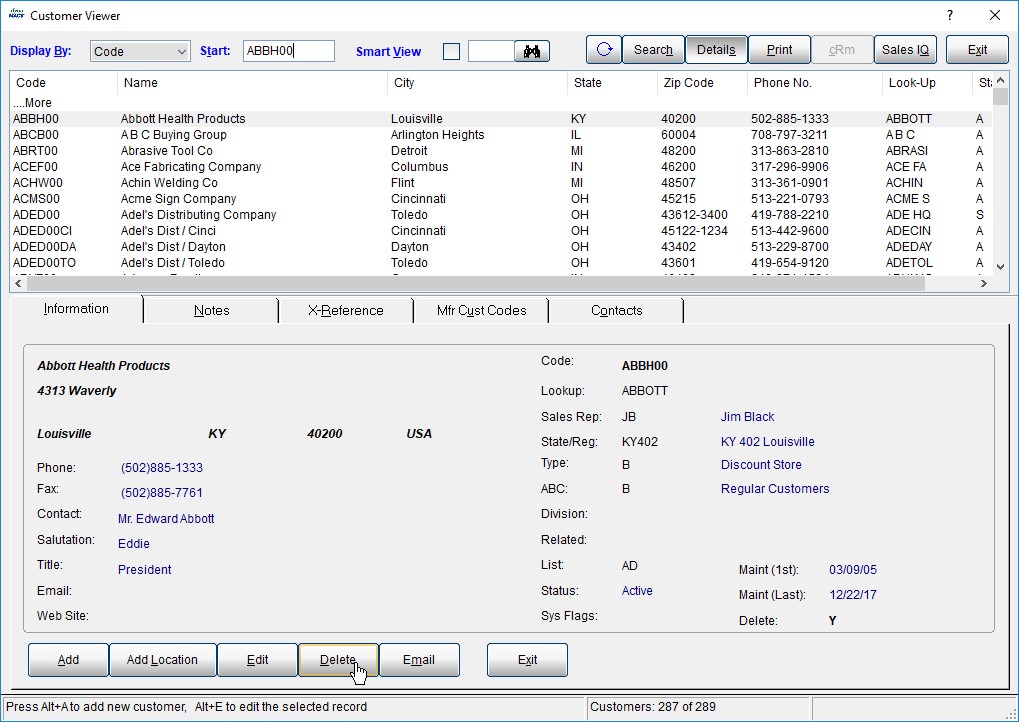
Tip #1712 – How to Delete a Customer from the dynaMACS Database
Follow the steps below to delete a customer that has merged with another customer or is no longer in business.
Move the history to another customer
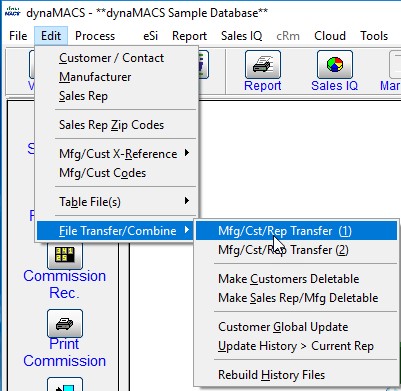
- Go to Edit drop-down menu.
- Select File Transfer/Combine.
- Choose Mfr/Cst/Rep Transfer (1).
- The Manufacturer/Customer/Sales Rep Transfer/Combine window will appear.
- Type in the customer that you want to delete on the left side (Example: Abbott Health Products) and the customer that you want the history to go to on the right side (American Instruments).
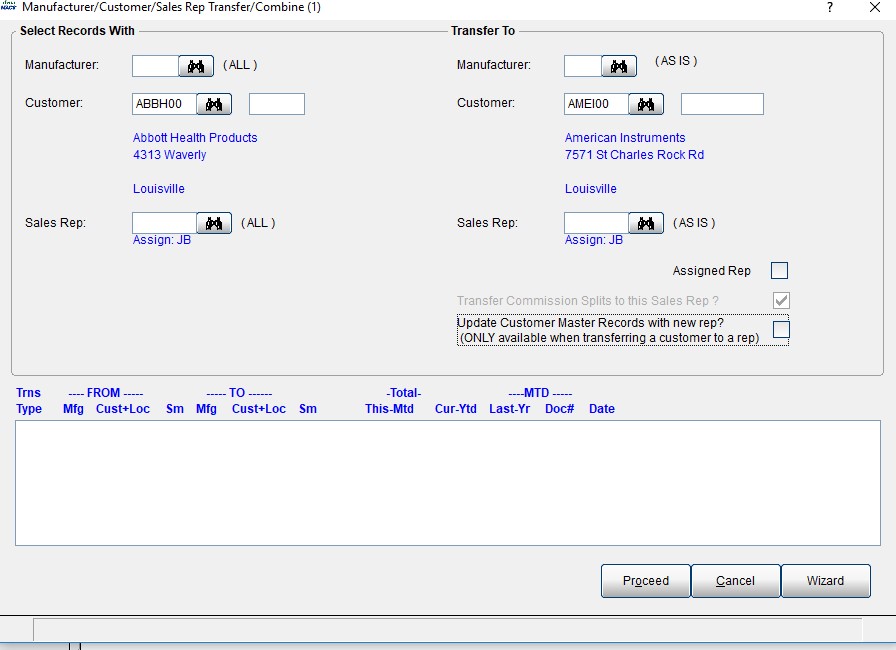
- Select the Proceed.
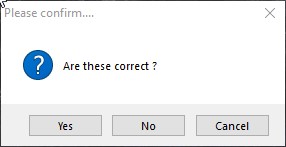
- Choose Yes at the prompt for Are these correct?
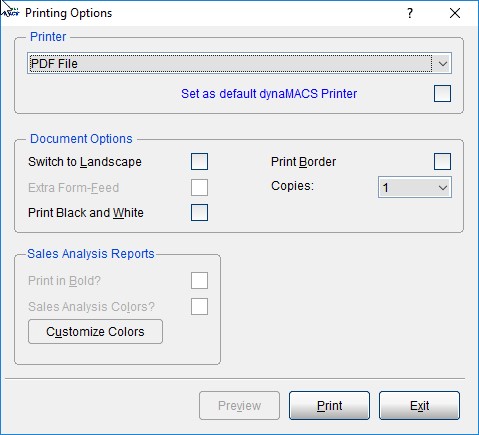
- Select the printer and print out the audit trail.
- Please confirm … choose Yes.
- The FYI window will appear, select OK.
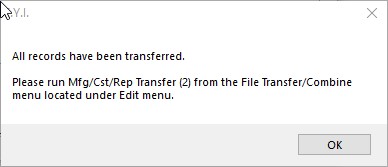
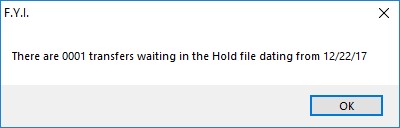
- At the 2nd FYI, choose OK.
- Follow steps 1-11 until you are done will moving the customers.
- Then select Cancel to exit this screen.
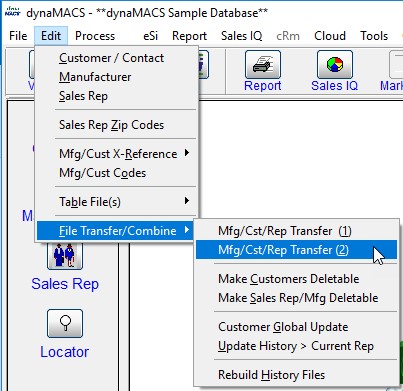
- Go to Edit drop-down menu.
- Select File Transfer/Combine.
- Choose Mfr/Cst/Rep Transfer (2).
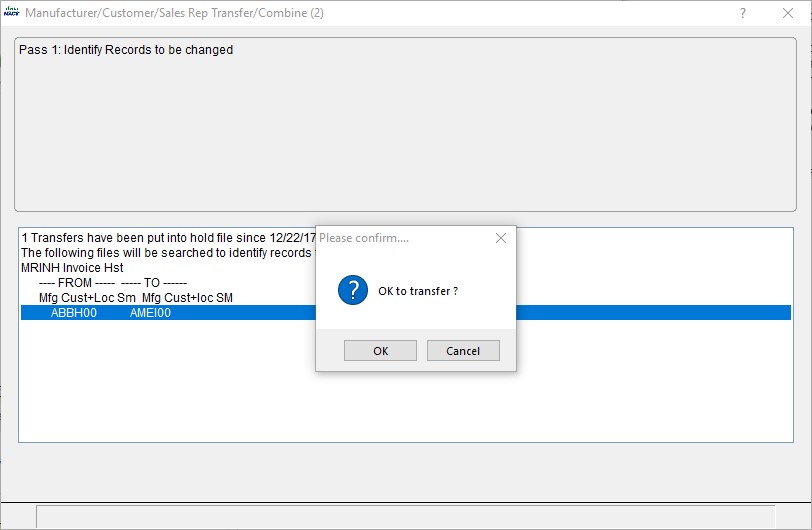
- The Manufacturer/Customer/Sales Rep Transfer/Combine (2) screen will appear.
- Select your printer and print the audit trail.
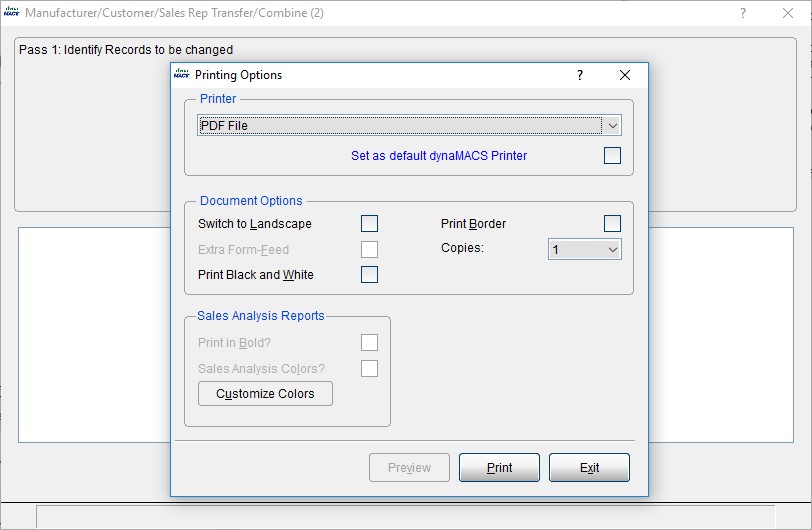
- Choose OK at the Please confirm window.
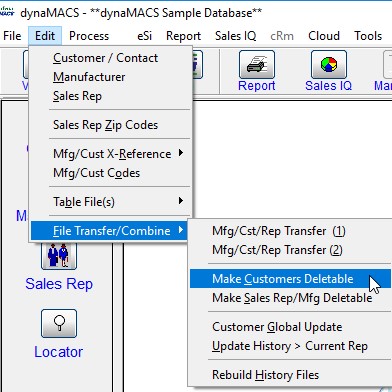
- Go to Edit drop-down menu.
- Select File Transfer/Combine.
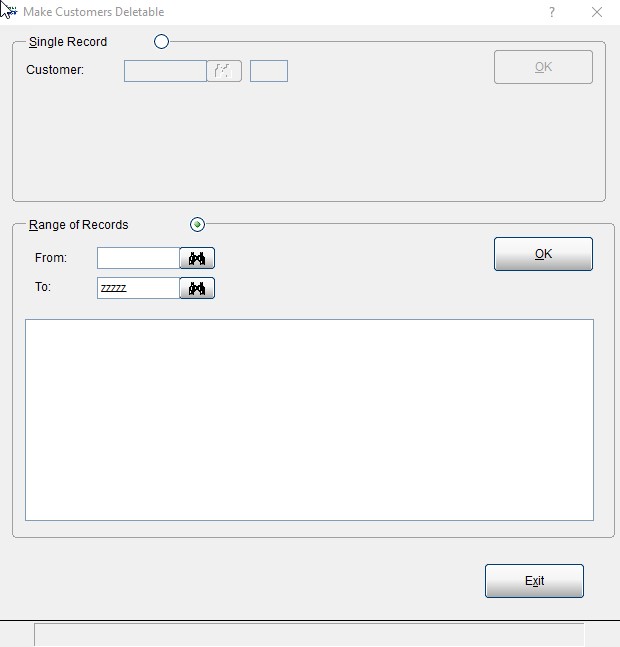
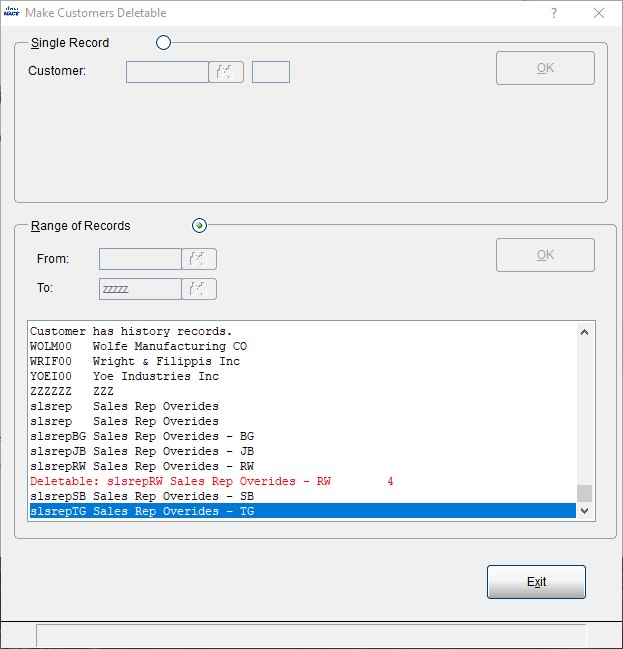
- Make Customer Deletable
- Select Range of Records. Leave the from field blank and type in zzzz in the To field. Then choose OK.
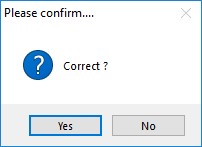
- Select Yes at the next window.
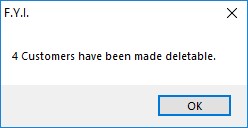
- At the end you will get a message that tells you how many customers were deletable. Choose OK.
- Select Exit when done.
- Go into the Customer Maintenance screen and select one of the customers that you transferred the history for and select the Delete button.