Posts

Case Study: State Side Sales

 “dynaMACS uses GoogleMaps to plan efficient routes when we visit multiple customers. We spend less time in the car and more time selling.”

Joe Durbin, President
State Side Sales, Inc.

Client Challenge

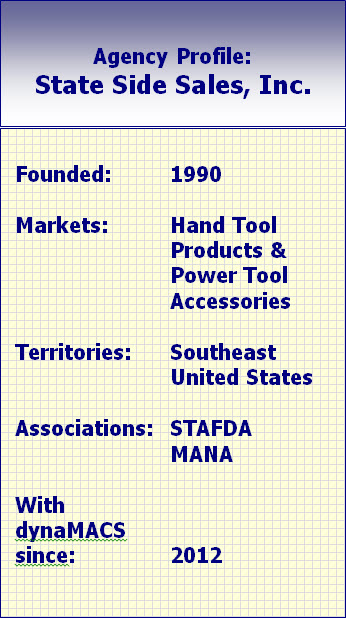
State Side Sales Agency was using rudimentary sales and commission software that didn’t provide enough useful information to meet their needs. The agency chose dynaMACS and instantly had a wealth of meaningful data to analyze performance, track trends and operate proactively. As the years passed, the agency became accustomed to having all the sales and commission information they needed at their fingertips. When State Side Sales stopped using dynaMACS and tried to get by with different software, they missed many of dynaMACS’ features.


dynaMACS Solution

Joe Durbin, President of State Side Sales, read an article on LinkedIn about dynaMACS’ ability to map routes when visiting multiple customers, and he saw an opportunity to improve his agency’s efficiency. “We were already missing our favorite dynaMACS features. When I saw the GoogleMaps function, I knew it was time to go back to dynaMACS. We now spend less time in the car and more time selling and building relationships.”

While looking at the sales numbers, reps select the customer addresses that they want to visit. A map view of all locations is displayed, along with the most efficient routes and directions between locations. Sales reps can also re-sequence the route if they choose. “We’re increasing efficiency, reducing travel time and maximizing reps’ time.”

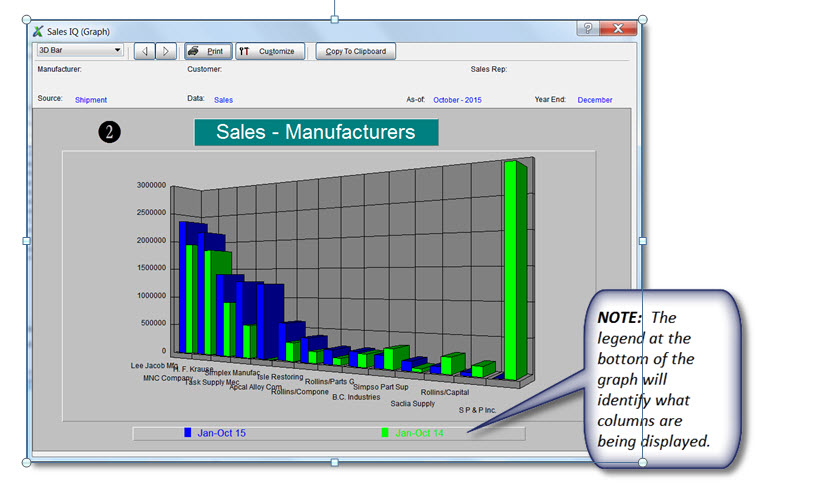
The agency also has the ability to select a territory and see performance data for the top 20% of manufacturer/customer relationships (using sales volume). “We use this as a performance indicator and we see trends faster. It’s another level of knowledge that we didn’t have without dynaMACS.”

dynaMACS continually adds new functionality, and the support team is on hand to show State Side Sales tips and tricks for extracting detailed information organized in meaningful ways, with just a few mouse clicks.

dynaMACS Software Overview Demo

Case Study: RWA

“Data entry time takes a fraction of what it used to. Manually entering thousands of lines of data took a week. With dynaMACS we’re done in 15 minutes.”

Mary Elizabeth Faulkner
RWA

RWA_LogoClient Challenge

RWA sales agency was using sales and commission software that had some basic functionality, but wasn’t delivering the level of information the agency needed to analyze performance and uncover ways to grow the business.

The agency was introduced to dynaMACS at a trade show when the President and CEO of RWA, Ron Wallace, as speaking to a colleague from another agency. Talk turned to sales and commission software and the other agency highly recommended the software they used, which was dynaMACS.

RWA_StatisticsdynaMACS Solution

RWA did some research and found dynaMACS to be a powerful sales and commission tool with the ability to analyze sales, pay reps, track commissions and access in-depth reporting.

Mary Elizabeth Faulkner supports the salespeople from the main office and says, “Reps get information that can be shown by manufacturer, distributor and much more. They always know what’s happening in their territory.”

Comprehensive reporting is essential for any agency. “dynaMACS shows meaningful, easy-to-understand reports that provide us vital information,” she says. The agency can sort and filter for more in-depth data and analyze the business in numerous ways.

RWA also reconciles manufacturer commission statements and runs reports to pay the sales reps. With dynaMACS eSi, the agency imports manufacturers’ sales invoices and reports electronically, with minimal manual processes. “Data entry time takes a fraction of what it used to. Entering thousands of lines of data manually took a week. With dynaMACS we’re done in 15 minutes.”

RWA saves time and resources and gains a wealth of knowledge about the agency.

Case Study: R C Bremer Marketing Associates, Inc.

 “Before implementing dynaMACS eSi, four people manually entered thousands of invoices. With eSi, one person enters all data. It saves us huge amounts of time and money. ”

Joe Falk, President
R.C. Bremer Marketing Associates, Inc.

RCBremer_LogoClient  Challenge

 Since beginning his career with R.C. Bremer 18 years ago, Joe Falk was a sales rep, obtained CPMR certification, specialized in safety and eventually purchased the company from Bob Bremer in 2007.

During the transition, Falk was glad that he and the team had selected dynaMACS as its agency software in 2003 because “it’s rep-specific. dynaMACS understands how we work and what we’re looking for,” Falk says. Having the right software in place was one less thing that required Falk’s time and attention during the transition.

RCBremer_StatisticsdynaMACS Solution

R.C. Bremer reaps the benefits of dynaMACS’ features that enable the agency to operate more efficiently and effectively, including:

eSi

With dynaMACS eSi the agency imports manufacturers’ sales invoices and reports electronically. “Before implementing eSi, end-of-month was a nightmare. Four people manually entered thousands of invoices. Now, one person enters all data. It saves us huge amounts of time and money,” Falk says.

Sales IQ

With Sales IQ, he looks at customer data in various ways. For example: “I look at this year’s versus last year’s data to see which lines are up or down.” he says. He is able to monitor the agency’s performance using recent sales and commission figures.

Commission tracking

Falk also tracks commissions. “Manufacturers are 30 to 60 days behind. We don’t get paid until they get paid.”

dynaMACS Mobile

R.C. Bremer sales reps can “take dynaMACS on the road.” They are able to download up-to-date numbers, so they have complete information on their territory.

For R.C. Bremer, dynaMACS has been the trusted solution for tracking sales and commissions and paying reps for more than 12 years…and going strong.

Case Study: BNT Sales Agency Limited

 “Before buying software, I did my homework. For every question or need I had, dynaMACS had a solution.”

Wade Wohlford, President / Welding Specialist
BNT Sales Agency

BNT_Sales_Agency_LogoClient Challenge

Spreadsheets used to be the rudimentary but necessary tool for BNT Sales Agency to track agency performance. The utilitarian process was time-consuming and limiting, showing only basic information. BNT needed more: the ability to see in-depth, organized sales and commission information.

When Wade Wohlford, President of BNT Sales Agency, saw a demonstration of dynaMACS at a trade show, he saw a world of opportunity; a wealth of sales and commission data at his disposal anytime – and the ability to see the agency in ways never before possible.


BNT_Sales_Agency_StatisticsdynaMACS Solutions

“I did my homework, comparing various brands of software. For every question or need I had, dynaMACS had a solution,” Wohlford says.

dynaMACS combines sales and commission information for all manufacturers, customers and sales reps in one database. Sortable, filterable data enables Wohlford and his team to see exactly the information they need, in the ways they want to see it.

With the ability to view data, sorted by manufacturer, customer or sales rep – and much more, “I can look at a quick snapshot of customer and manufacturer numbers, or analyze in-depth data,” he says. Wohlford sees which territories are up or down, “We can identify which product lines to focus on.”

Wohlford says he also looks at year-over-year data, comparing this year to last for a full understanding of agency performance.

When it comes to analyzing sales, paying reps and tracking commissions, dynaMACS went beyond meeting BNT Sales Agency’s individual and specific needs. It changed the way agency operates.

Tip #1510 – Newly Enhanced Graphing Features in 2015

dynaMACS has made the graphing capability easier than ever.  We have created an instant graph option and a simpler way of placing the graph in other software.  The following outlines the changes to this feature.

Quick Graph

In dynaMACS 2015 you have the option for a Quick Graph which will directly open up a graph based on the selections in the Sales IQ screen.  This is now the default for the Graph button.

  1.  From the Sales IQ screen, click on the Graph button or the Down Arrow next to the Graph button and then select Quick Graph.
  2. The Graph screen will appear displaying the information based on the selections that were made in the Sales IQ screen.Graph Screen with Note

Graph

You can also use the regular graphing feature to change column headings and the graph title.

1.  From the Sales IQ screen, click on the Down Arrow next to the Graph button and then select Graph.
Graph Button


2. This feature will display the Select Columns to Graph screen where you can change the default column headings for your graph.

Columns to Graph

Graphs Can Now be Easily Copied to Clipboard

Copying the graph has never been easier.  By selecting the Copy to Clipboard button while in the Graph screen the graph will be copied to the clipboard and you can easily paste it into any document.

Sales IQ Graph - Copy to Clipboard