dynaMACS is easy-to-use, yet provides powerful data analysis capabilities. From analyzing sales, to paying sales reps and tracking commissions, dynaMACS is a comprehensive software designed specifically for sales agencies.
This section gives you a brief overview of the product, its features and benefits, examples of screen shots and the types of information you can access in just a few mouse clicks.
Up-to-date sales and commission data at your fingertips
dynaMACS is a software tool that provides sales agencies a fast, flexible and reliable way to manage sales and commission data. Analyze sales. Pay reps. Track commissions. All with one easy-to-use software.
Software benefits
- Always up-to-date data – No waiting to close prior month before entering new data.
- Reports to meet your needs – Extensive reporting formats to segment data by manufacturer, customer, sales rep, territory and more.
- Analyze sales and trends – Five-year sales history on one screen.
- Funnel information from factories into one database – Easy entry of various factories’ invoices and commission statements into the dynaMACS database, with input screens that make data entry a breeze.
- Control totals and audit trails – Balance commissions to the penny, and check totals before entries are posted.
- Accurate sales reporting – Post invoices to the months in which the sales occurred – rather than when the agency received the information.
- Accurate commission payments – List all commissions received during the month, to ensure you’re compensating sales reps correctly.
- Pre-filled fields – Automatically assign the correct sales rep for a customer/manufacturer and automatically calculate commission.
- Adapt to manufacturer year-end – Change fiscal year-end to match that of any manufacturer.
- Quickly transfer data – When sales territories are reorganized.
- Compare past periods – See totals for current month, year-to-date, last year-to-date and compare in dollars and/or percentages.
- Easy-to-read charts & graphs – Quickly generate colorful pie charts, bar charts, graphs and more, for use in presentations.
- Shorten the learning curve – Windows-based software is easy-to-use, even for novices.
- Don’t sacrifice security – The highest security measures ensure your data is safe.
Powerful data analysis is simple
dynaMACS is simple yet powerful. For example, look at all the information you can access with just a few mouse clicks:
“Can I rank my customers based on all manufacturers they buy from?”
Easily rank your agency’s customers based on the manufacturers they buy from. Here, customers are displayed in descending order.
Notice in the screen shot below that a particular customer—Adel’s Distributing/Cincinnati—is highlighted in blue.
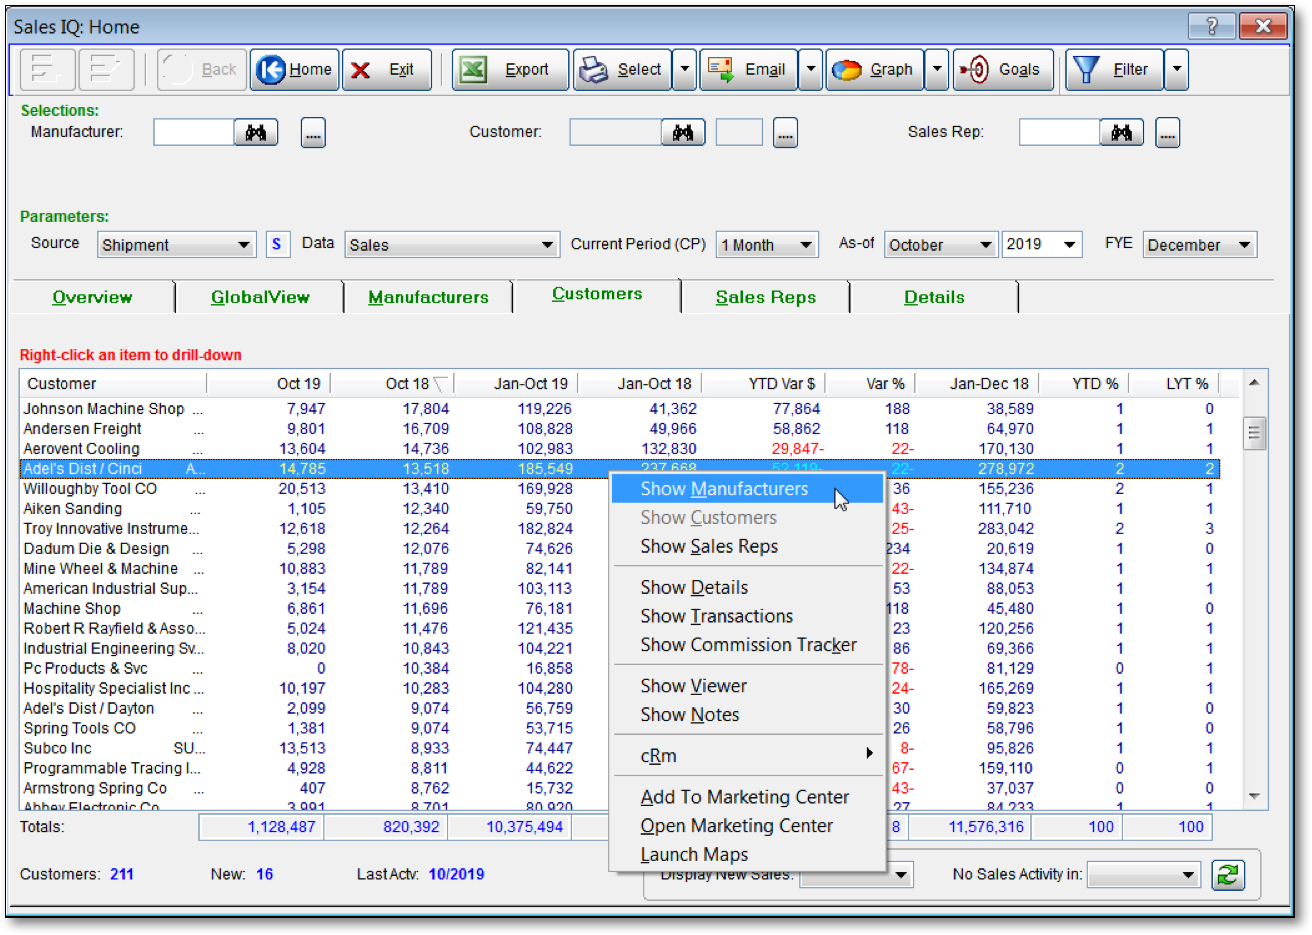
By clicking once more, the screen displays the highlighted customer and all manufacturers they buy from (as shown above).
“Can I see all the manufacturers that a particular customer buys from?”
All the manufacturers from which the highlighted customer—Adel’s Distributing/Cinci—buys are shown.
This screen shows performance this year versus last year for each manufacturer.
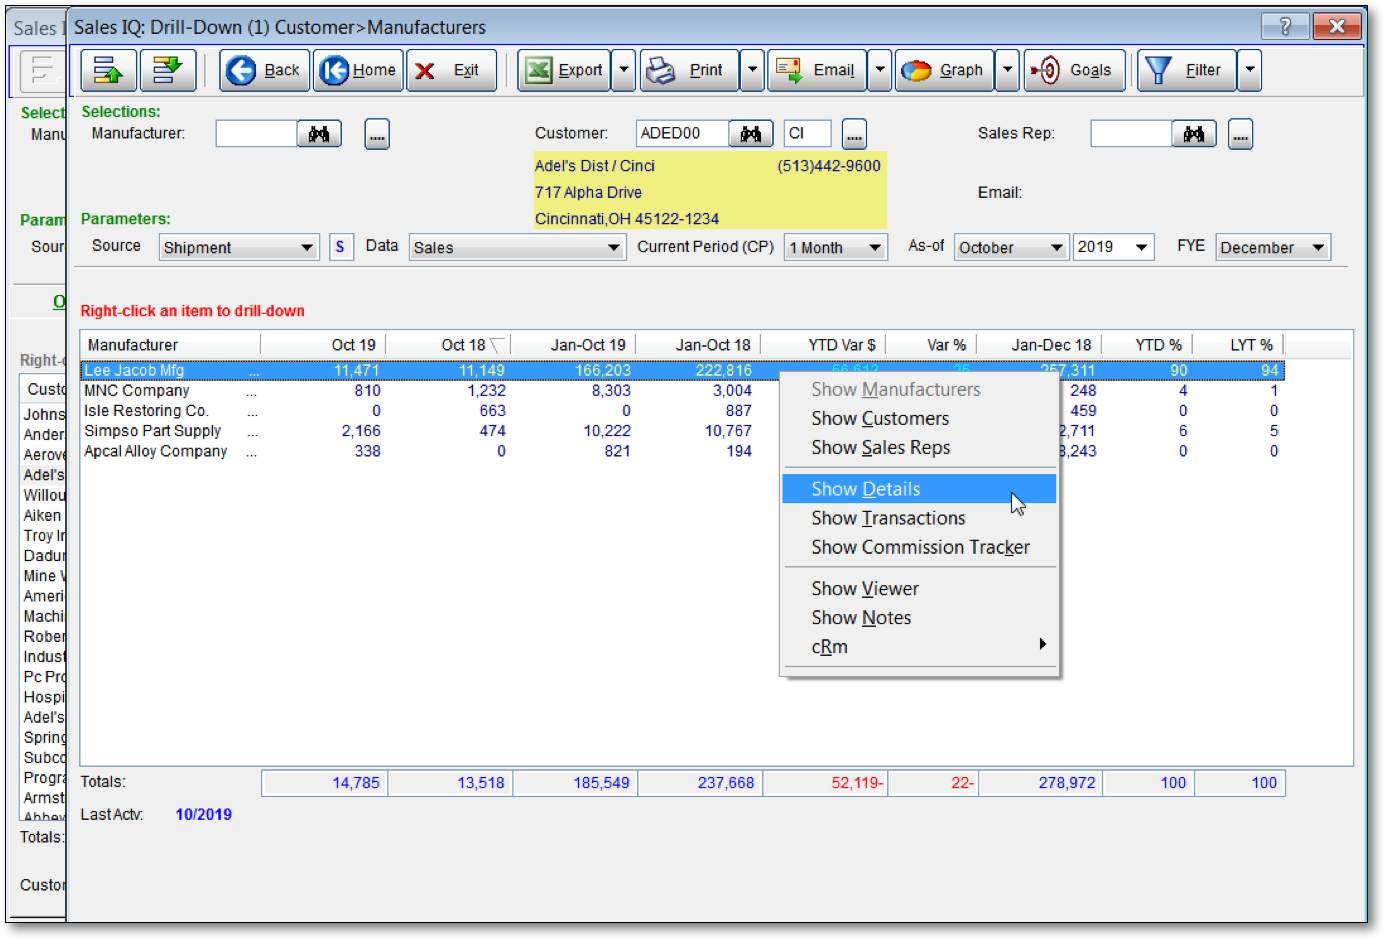
By highlighting one of the manufacturers displayed (Lee Jacob Mfg), right clicking and selecting Show Details, you can see a five-year history for the highlighted manufacturer and customer (see screenshot below).
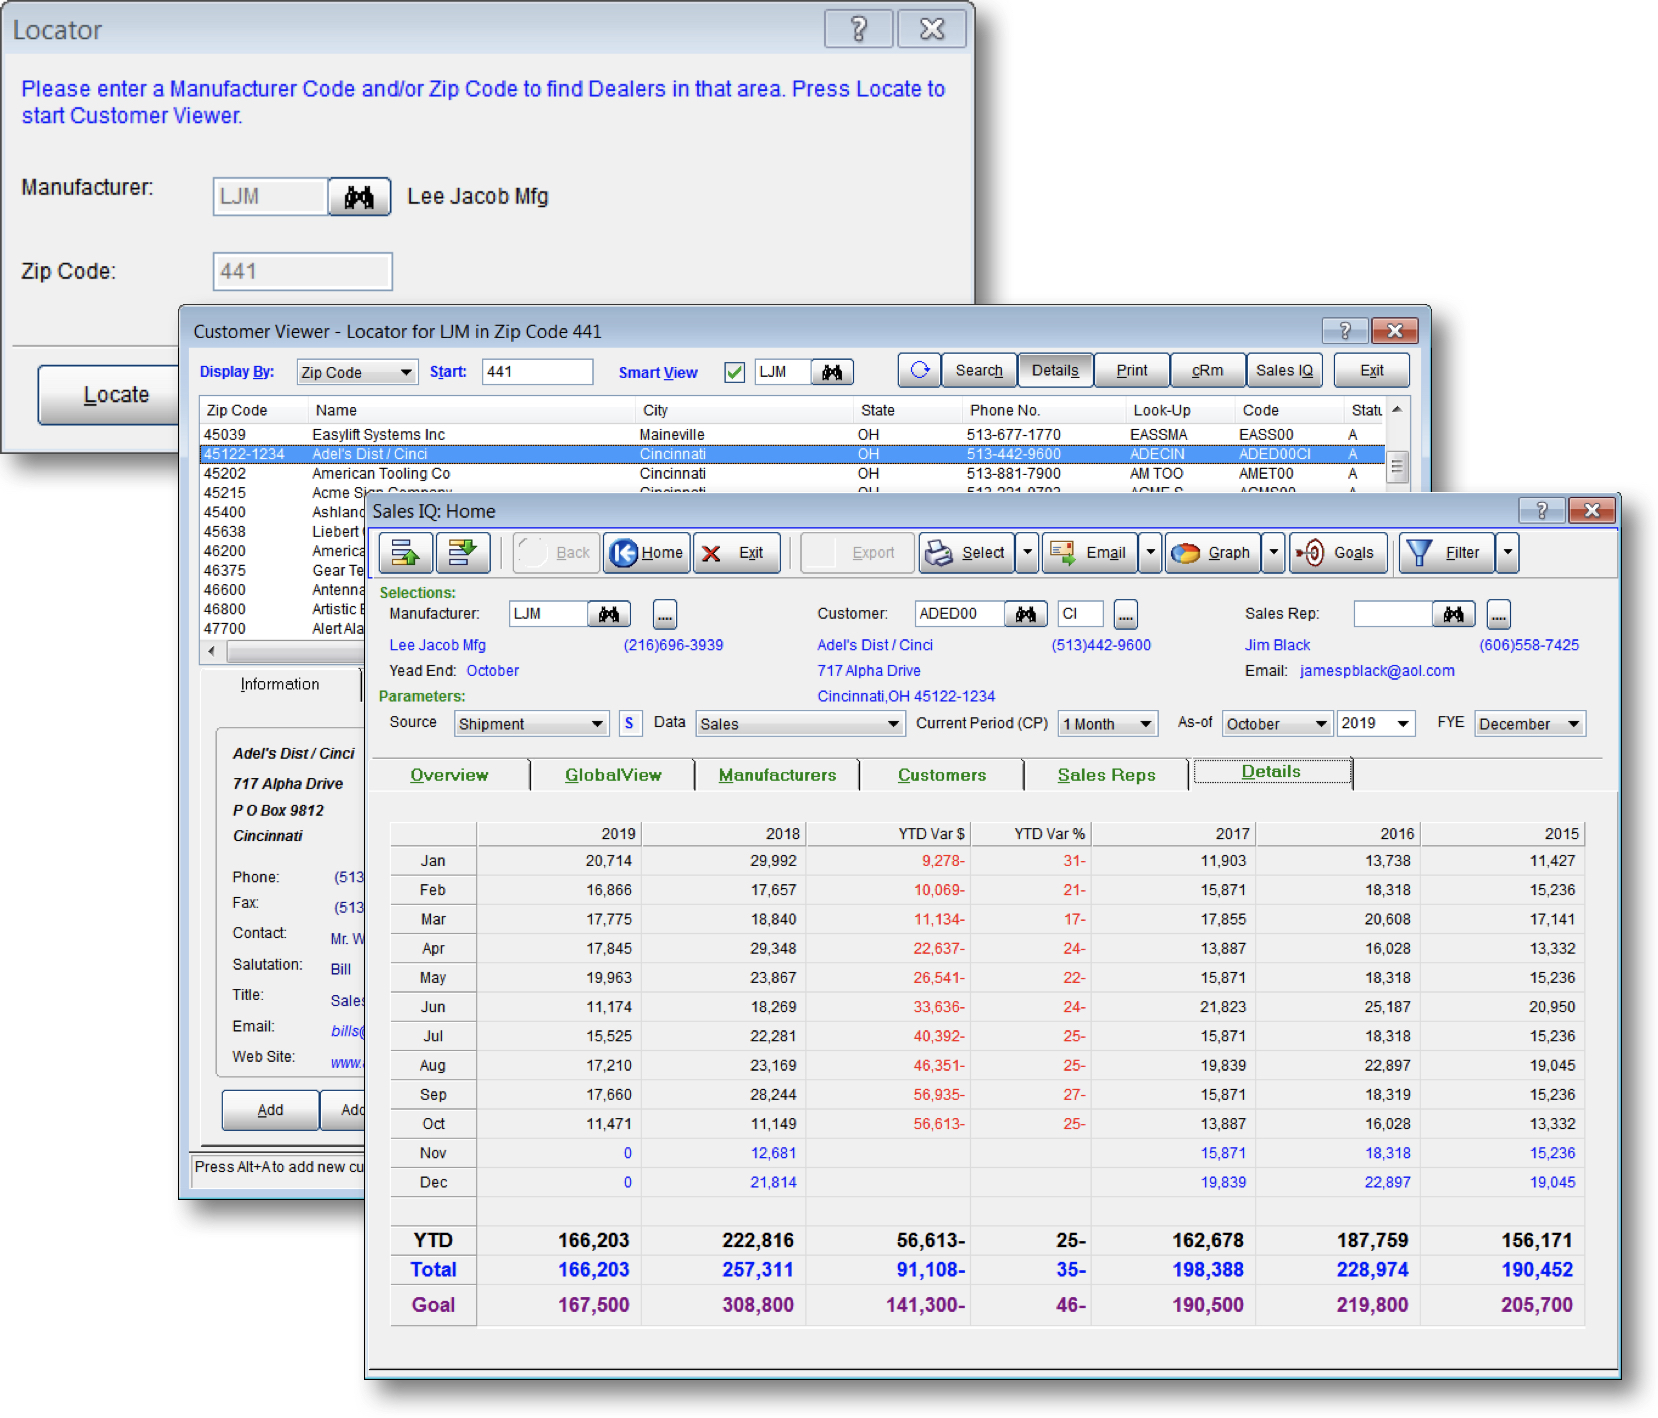
“Can I see a five-year history for a selected customer and manufacturer?”
A five-year history for the highlighted customer and manufacturer displays. Shown (in dollars and percentages) is a year-to-date sales comparison for this year versus last year, plus sales history for the previous years – all one on screen.
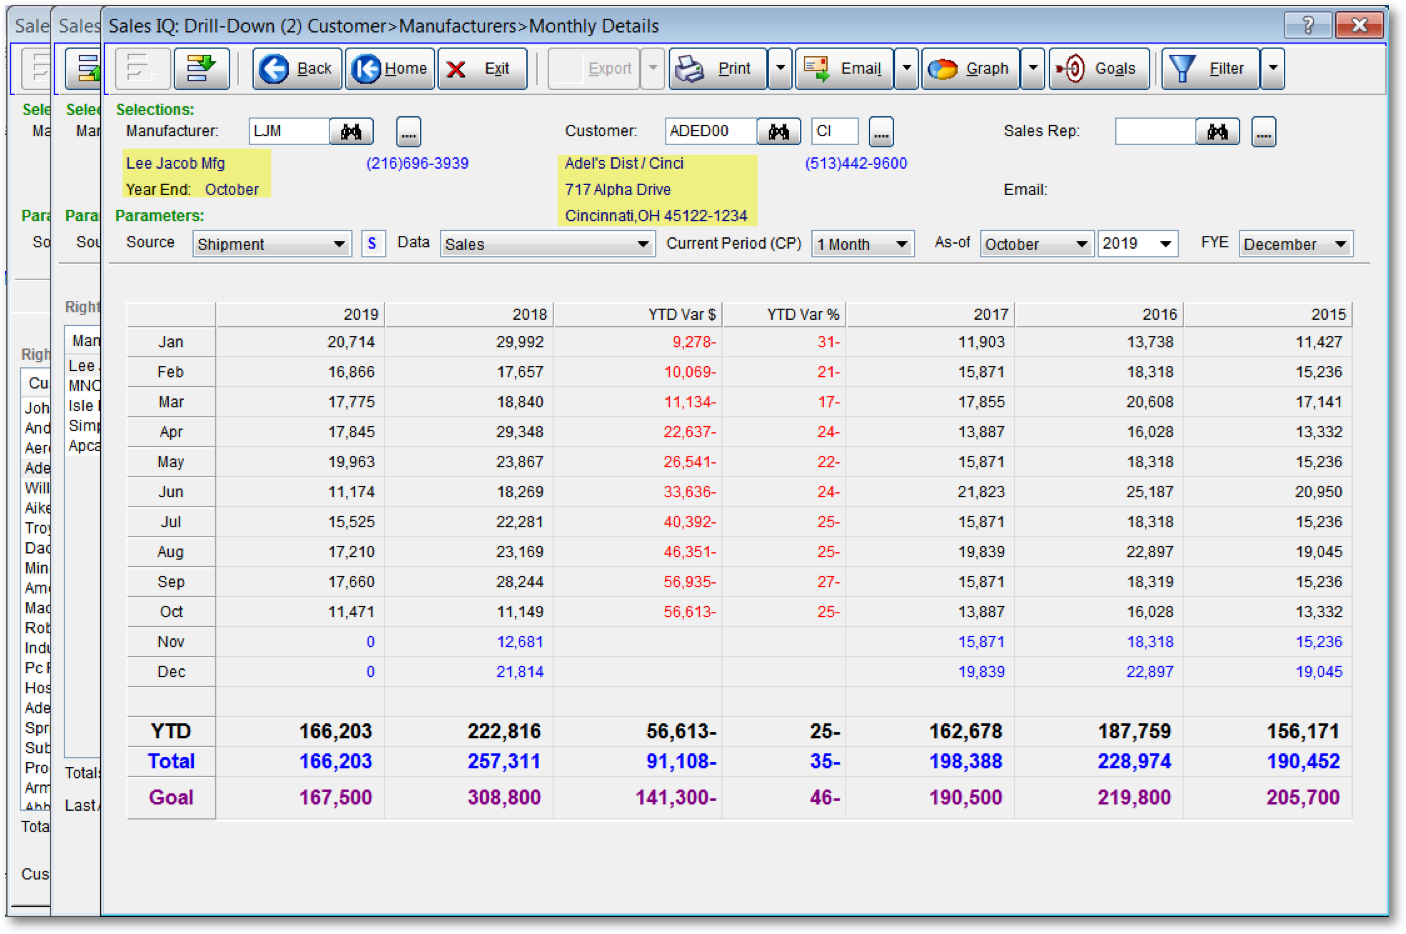
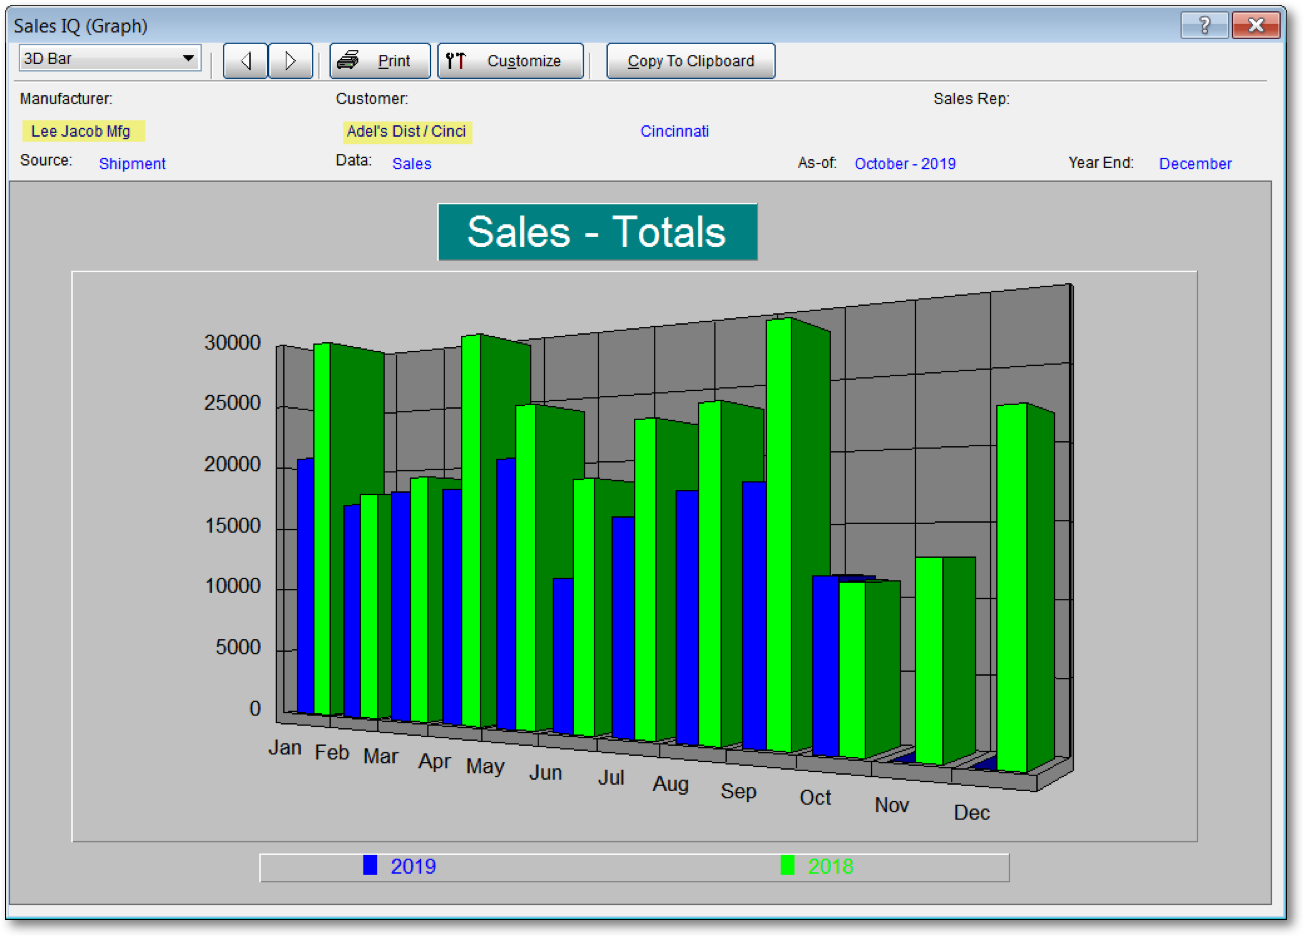
Turning this information into a colorful chart or graph for use in sales presentations requires just a few more clicks, as shown in the example below.
“Can I put the numbers in a graph format that I can use in presentations?”
Simply select the criteria for your graph…
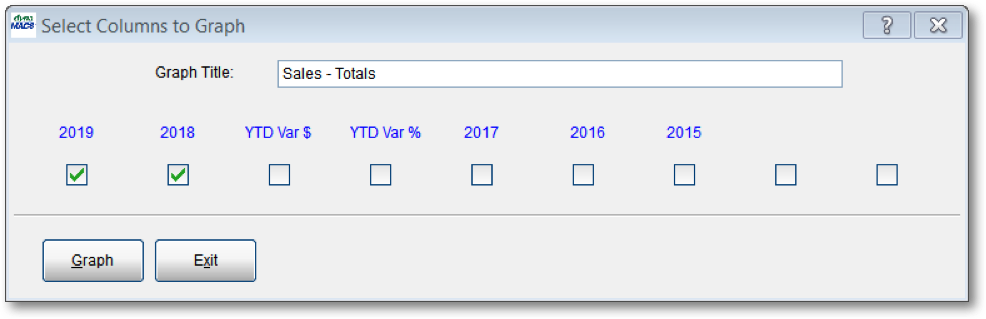
…and information is now displayed (and printed, if desired) as an easy-to-read graph. You can also customize the graph, by changing colors, fonts, labels and much more.
Locator
Another feature dynaMACS offers (that many agencies find invaluable) is the Locator. The Locator enables you to identity a manufacturer (simply by typing the first few letters of the name) and zip code (you need enter only the first few digits). The locator instantly brings up the Customer Viewer which displays customers who buy from that manufacturer in the same zip code that you entered.
By right clicking and selecting Sales IQ you can view the sales detail for each customer to determine the best customer for this manufacturer in this zip code.
Summary
dynaMACS is the ideal software for sales agencies large and small. One way we meet the needs of all sales agencies is by dividing the software into modules. For many agencies, the Standard System meets their sales and commission tracking requirements. Other agencies choose to add Optional Components.
Whether you opt for the Standard System or choose to add Optional Components, you will receive a complete solution that provides instant access to critical performance information.