Tip #1311 – How to Display Quarterly Numbers in Sales IQ
This tip is superseded by Tip #1508
In dynaMACS Sales IQ you can modify the display of data by changing the As-of and Year End dates to create a display of sales information for a specified period of time. The following examples explain how to achieve these results.
Example 1:
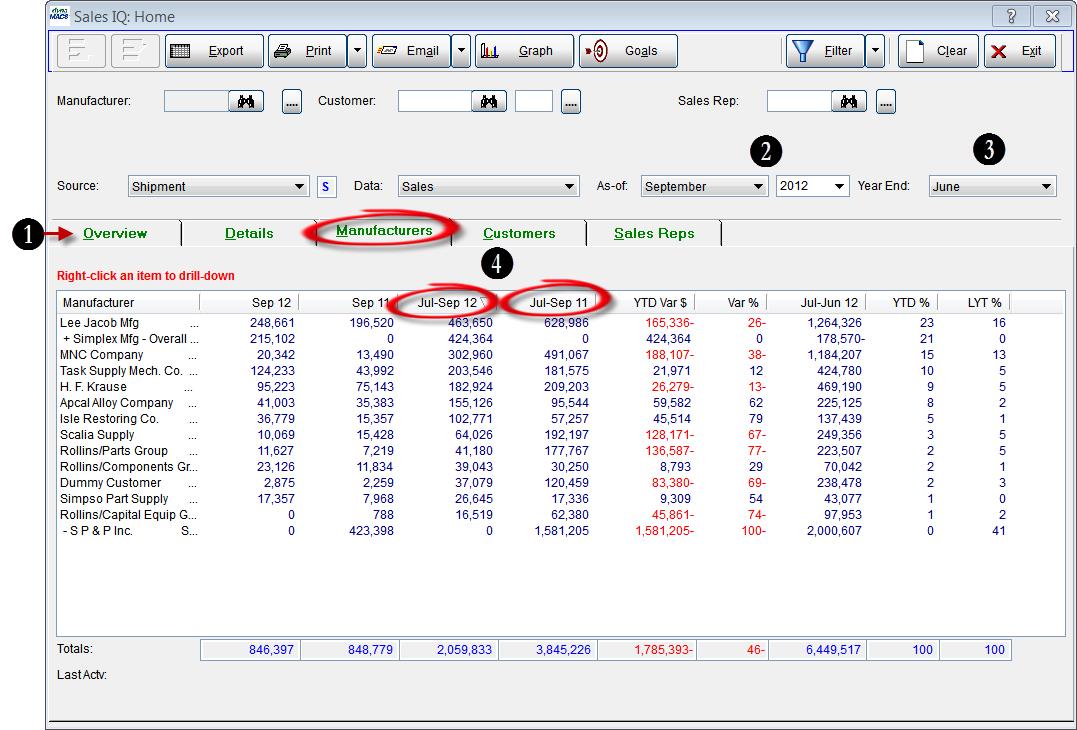
To create a Sales IQ list view displaying sales data for the 3rd quarter of the year 2012:
- From the Sales IQ Home screen select any tab. In this example we have selected the Manufacturers tab.
- Change the As-of date to the last month of the quarter you are reporting. In this case it will be September which is the last month of the 3rd quarter.Then select the year that applies.In this example we are selecting 2012.
- Change the Year End to the month prior to the start of the period you are reporting on. In this case it will be June since our quarter begins with July.
- Notice that these columns have changed to Jul-Sep12 and Jul-Sep 11 representing 3rd quarter data for 2012 and 2011.
Example 2:
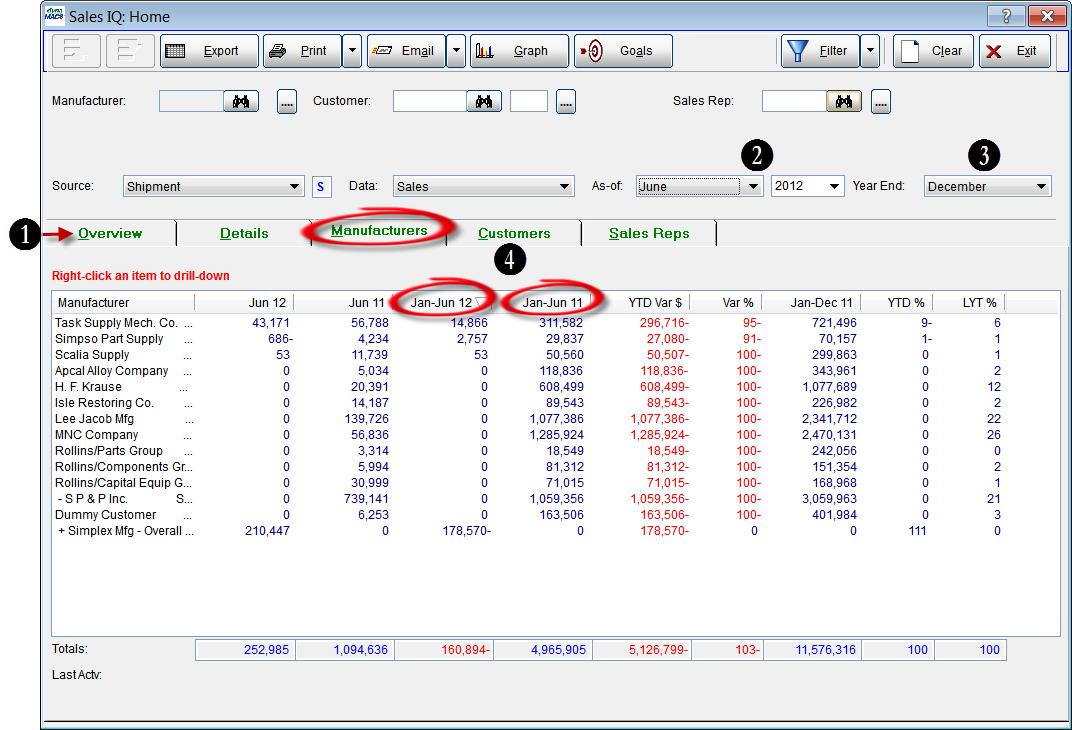
To create a Sales IQ list view displaying sales data for the first half of the year 2012:
- From the Sales IQ Home screen select any tab.In this example we have selected the Manufacturers tab.
- Change the As-of date to the last month of the half you are reporting.In this case it will be June which is the last month of the 1st half of the year. Then select the year that applies.In this example we are selecting the year 2012.
- Change the Year End to the month prior to the start of the period you are reporting on.In this case it will be December since our first half begins with January.
- Notice that these columns have changed to Jan-Jun 12 and Jan-Jun 11 representing 2nd half data for 2012 and 2011.
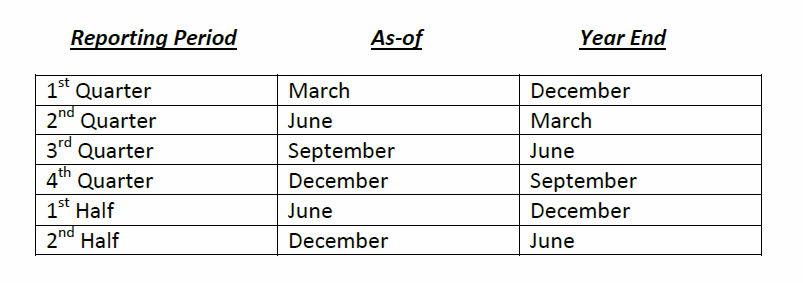
Quick Reference Guide
The following is a quick reference guide to use for obtaining quarterly and semi-annual data.