Tip #1610 – Understanding the Symbols and Codes on a dynaMACS Sales Analysis Report
When reviewing your dynaMACS Sales Analysis reports there are two symbols to look for that will easily identify customers with first time sales as well as customers with no sales in 3+ months. There are also codes that are displayed to help you identify Column Settings and Sub Totals that where selected for this report as well as filters that may have been used.
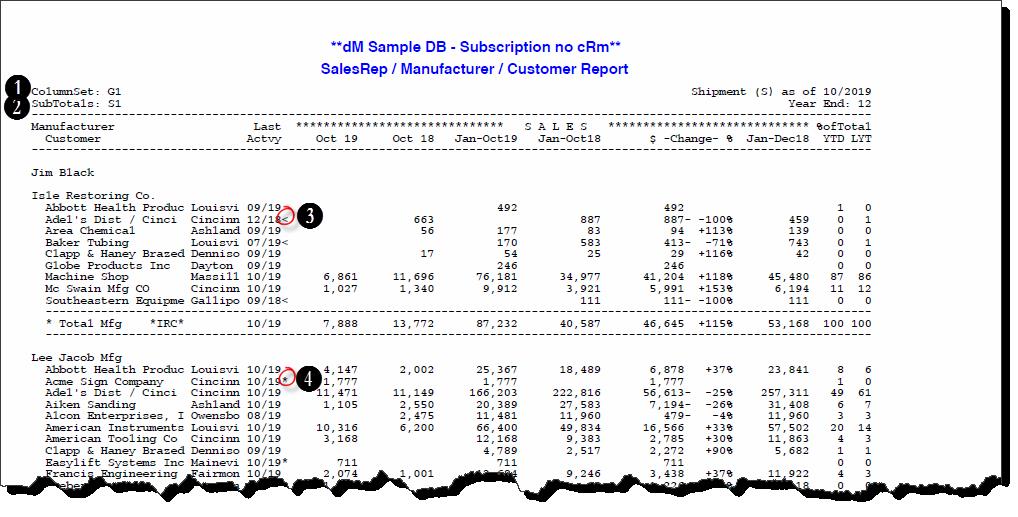
- The Column Set displays the Column Set that was chosen when creating the report. In the following example G1 was selected.
- The Subtotals displays the Subtotals Code that was selected when creating this report. In the following example S1 was selected.
- Customers that have a Less-Than (<) sign to the right of the Last Activity date are those that have no sales in 3 months or longer.
- Customers that have an Asterisk (*) to the right of the Last Activity date are first time buyers.
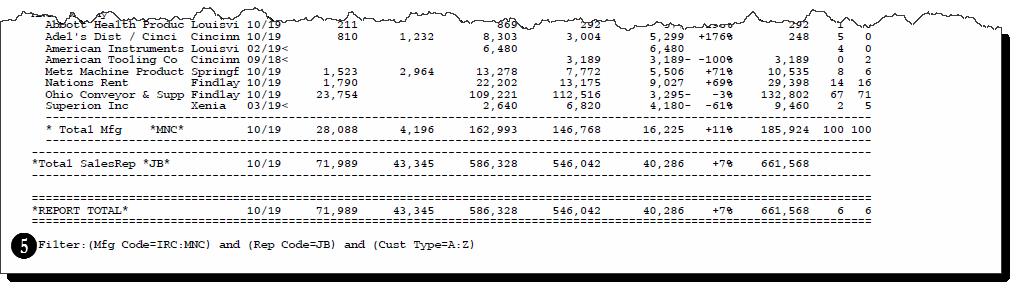
- The Filter field at the bottom left hand corner of the report will display all of the filter selections chosen when creating this report. In this example we have selected Mfg Code IRC thru MNC, Rep Code is JB and Cust Type A thru Z.