Tip #1403 – Using Sales Entry Options to Customize Your Sales Entry Screen
To increase efficiency during sales entry, you can customize some settings temporarily for the current session or permanently for all sessions. You can even have different customized settings for each manufacturer.
Changing “Sales Entry Options” Default Settings
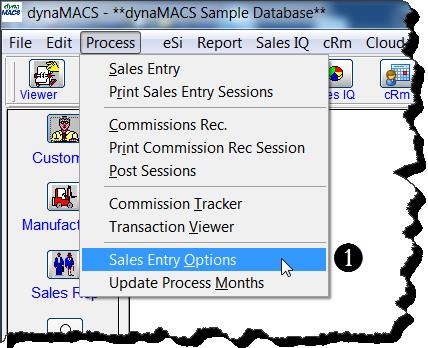
- From the dynaMACS main screen menu options select Process Sales Entry Options.
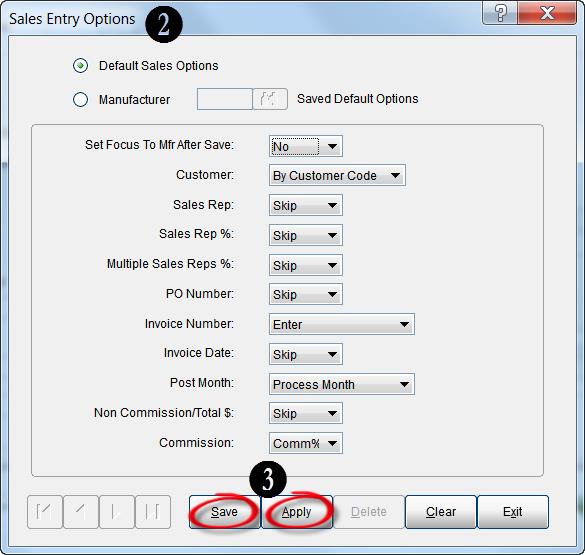
- The Sales Entry Options window will open. Each customizable option correlates to a field on the Sales Entry screen.
- Select the applicable options from each drop down list and then choose the Apply button to apply these settings to the current session. Select the Save button to save these settings as the default settings for all future sessions.These default settings apply to all manufacturers without an established record in Sales Entry Options. See the next section in this document on Changing Sales Entry Options for a Manufacturer to customize sales entry for a manufacturer.


Changing Sales Entry Options for a Manufacturer
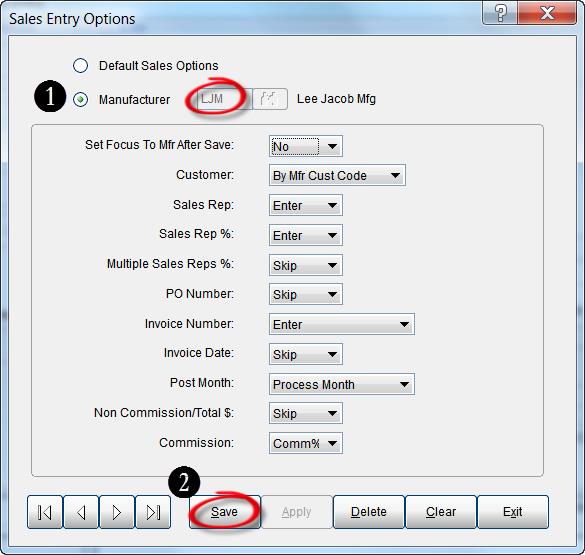
The Sales Entry Options screen also allows you to create customized entry options for individual manufacturers by selecting a manufacturer, choosing the applicable options and then selecting the Save button. Once you have sales entry options saved for a manufacturer, each time you enter sales for this manufacturer the Sales Entry screen will reflect the options chosen here for that manufacturer.
- From the Sales Entry Options screen select the Manufacturer radio button and enter the Manufacturer Code.
- Select the applicable options from each drop down list and then choose the Save button. These options will be saved for all Sales Entry sessions for that manufacturer.

Field Descriptions and Available Options for Customizing Sales Entry fields:
Set Focus to Mfg After Save – Selecting Yes will save the settings so that after saving an entry the Mfg code is saved for the next sales entry. Selecting No will leave the Mfg field blank for the next sales entry.
Customer – Allows you to select the customer using Customer Code, Manufacturer/Customer Code or Manufacturer Related code. This is useful when you are entering from a sales report or commission statement that has the manufacturer’s customer code.
Sales Rep – By selecting Enter the cursor will STOP at the first Sales Rep field (primary). By selecting Skip the cursor will SKIP the first Sales Rep field primary.
Sales Rep (%) – Commission split percentage for the primary sales rep.
- Enter (default) – Allows operator to enter an override for the rep split.
- Skip – Bypass this field.
Multiple Sales Rep % – Allows entry of second and third sales reps and their commission split percentages. Note: Rep (%) must be active.
- Enter (default) – Sets the fields as active; however, the cursor skips over these fields to minimize keystrokes during entry. You can use the Shift-Tab keys to go back and change these fields.
- Skip – Bypass this field.
P.O. No. – Allows entry of the Purchase Order number.
- Enter – The cursor stops at this field for entry of each purchase order number.
- Skip (default) – bypass this field.
Invoice No. – Allows entry of the invoice number.
- Enter (default) – Cursor appears in this field for entry of each invoice number.
- Skip – Bypass this field.
Invoice Date – Allows entry of the invoice date.
- Enter (default) – The cursor stops at this field for each invoice.
- Skip – The field stays active but the cursor does not stop at this field. You can use the mouse or the Shift-Tab keys to go back and change the invoice date.
Post Month – Sets the month/year for posting of the sales entry. (Field is always active but the cursor does not stop at this field to minimize keystrokes. You can use the Shift-Tab keys or the mouse to go back and change it. If you change this field, it changes back to the original setting after the current entry is saved.)
- InvMth (default) – Uses the month and year from the invoice date as Post Month. This is the default setting for dynaMACS.
- PrMth – Uses the Process Month as the Post Month. The Process Month is in the yellow box under the Options toolbar on the Sales Entry screen. If this month and year is not correct, cancel the session and start over.
Non-Comm/Total $ – Allows entering non-commissionable amount to calculate the total for the entry.
- Enter (default) – Cursor stops in this field after entering Sales ($) amount to enter freight or discounts.
- Skip – bypass this field.
Commission – Activates the field for entering commission by amount of percentage.
- Comm$ (default) – Activates the Commission$ field to enter a commission amount.
- Comm% – Activates the Comm% field to enter a commission percentage.