“dynaMACS’ commission reconciliation module saves us thousands of dollars each year. We would be lost without it.”
Kelly Hodges, VP of Finance / Marketing Coordinator
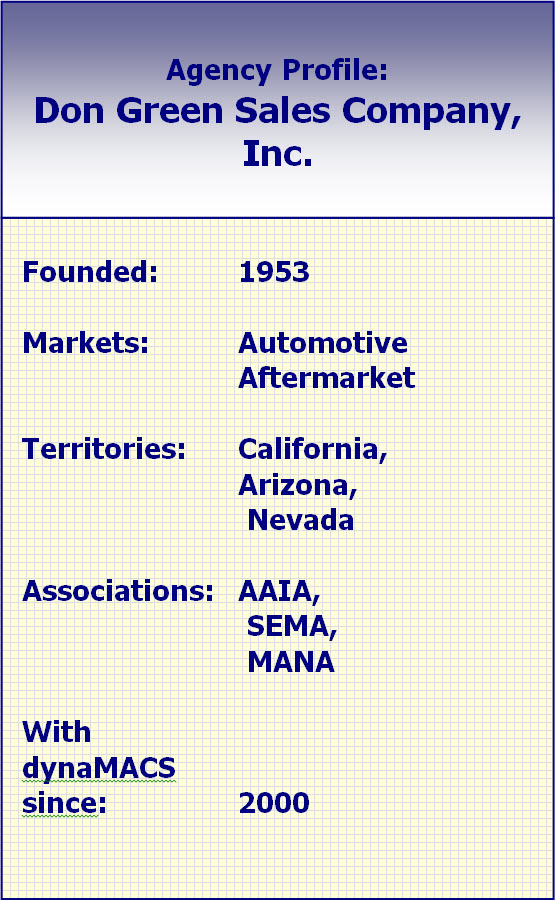
Don Green Sales Co., Inc.
 Client Challenge
When Don Green Sales Co. Inc., compares “the old days” of manually tracking sales and commissions to today with dynaMACS software, Marketing Director / VP, Finance Kelly Hodges says, “It’s like going from the Flintstones to the Jetsons.”
This busy agency doesn’t have time to waste on manual processes for entering data, tracking sales, reconciling invoices and paying commissions. Instead, it requires software that is automated, easy-to-use and reliable.
dynaMACS Solution
“dynaMACS has simplified our lives drastically, even with the thousands and thousands of invoices we receive each month,” Hodges stated.
Don Green Sales has partnered with MACS Software, creator of dynaMACS, nearly 20 years, and along the way has seen the software keep pace with the needs of manufacturers’ sales agencies and reps.
However, the agency did its research and looked at other Windows-based softwares before deciding to make the switch from MACS to dynaMACS. In the end, the agency selected dynaMACS. “The conversion was effortless, the Windows-based interface was simple and we didn’t have to learn another software,” Hodges said. She went on to say that by identifying unpaid manufacturers’ invoices, commission reconciliation has more than paid for the software’s cost.
The agency also uses dynaMACS Mobile so, “our salesmen are as current as the office is. Invoices are entered right away. The field knows about new sales so they can manage their territories effectively.”
*This case study was completed in 2006