Tip #1204 – Getting More out of Your Sales IQ Graphs
As you know, dynaMACS Sales IQ has powerful graphing capabilities. You can create a colorful graph for virtually any combination of information that is available to you in Sales IQ. Here are a couple of things to increase your graphics experience.
- The ability to change the default title of your graph
- Using the Copy to Clipboard feature which allows you to paste your graph into an email, Microsoft Power Point presentation, Microsoft Word document, or any other word processing document.
The following tips will help you better understand how to use these Graph features in dynaMACS.
Changing the Default Title on a Graph
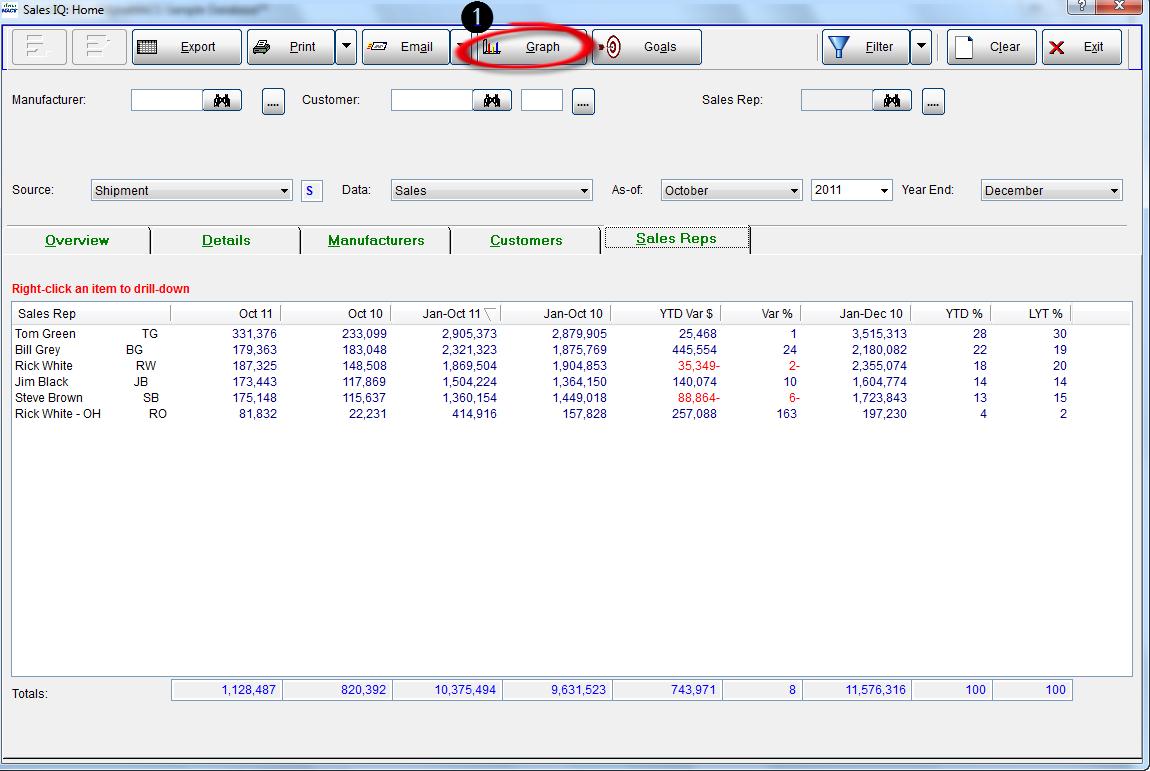
In the following example we have selected the Sales IQ button and then selected Sales Reps tab.
- Select the Graph button from the Sales IQ screen.
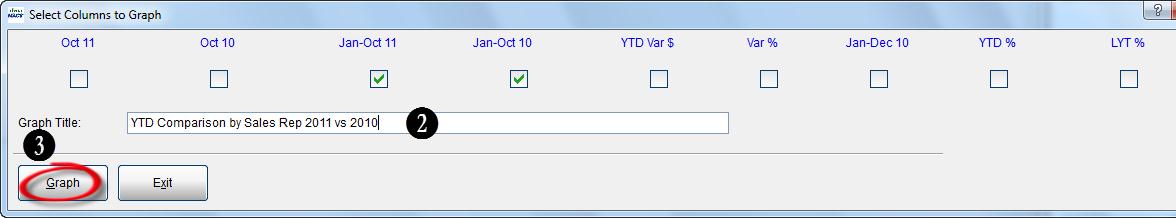
- After selecting the data to be included in the graph, override the default Graph Title with the desired title.
- Select the Graph button.
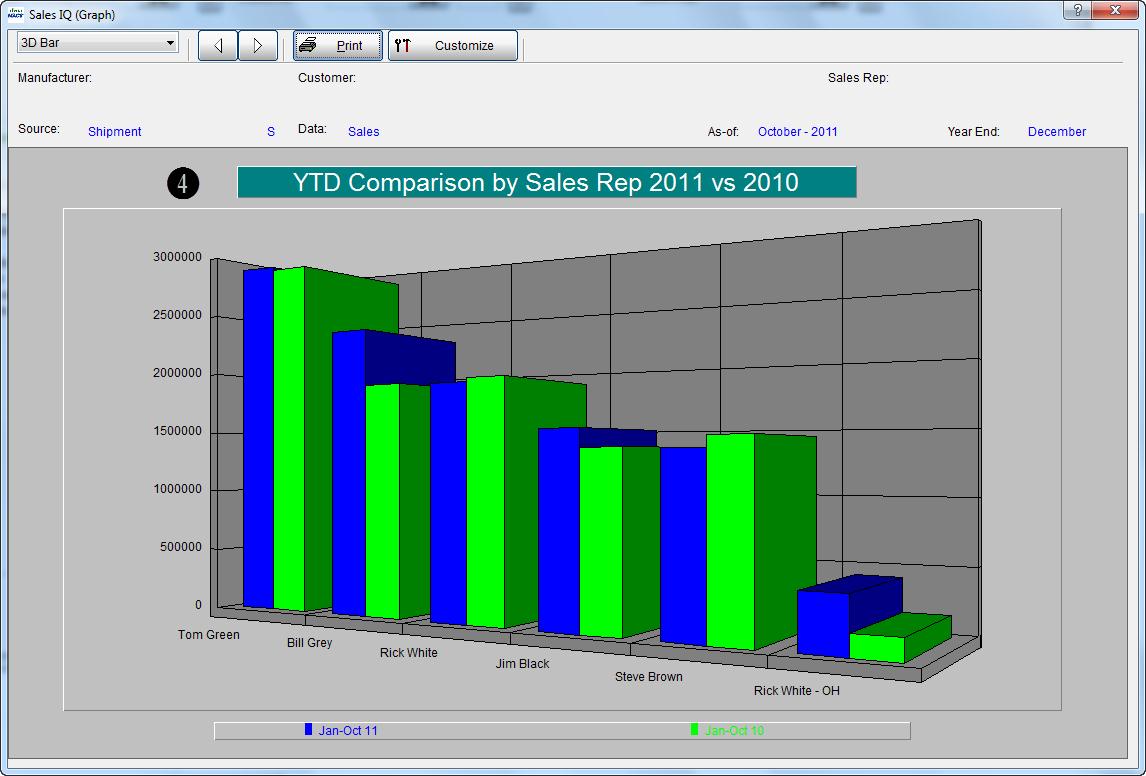
- You will see the newly created graph with the overridden Graph Title.


Copy to Clipboard Feature
The dynaMACS graphing feature allows you to copy and paste any graph that you have created in dynaMACS into an email or other document.
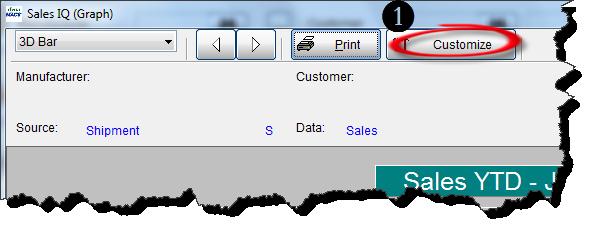
- From the Sales IQ Graph screen select the Customize button.
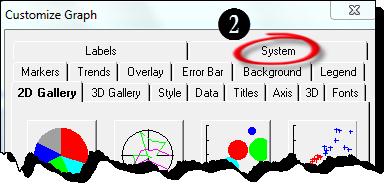
- In the Customize Graph screen select the System tab.
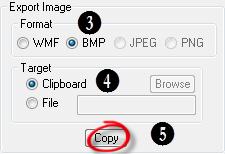
- Select the desired Format.
- Select Clipboard for a target.
- Select the Copy button.
- Your graph is now on the clipboard and ready for pasting into the desired document by using that applications paste function (or by using Ctl V on your keyboard while in the application.)


