Tip #1307 – Analyzing Top and Bottom Performing Accounts
The Sales Analysis Report Generator is a powerful feature of dynaMACS that provides you with virtually limitless possibilities for generating vital sales and commission reports.
Using the Sales Analysis Report Generator we will demonstrate how you can create a sales and commission report that will summarize total agency performance and identify the top and bottom 20 customers based on year-to-date sales increase/decrease.
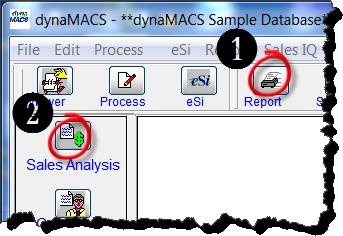
- From the dynaMACS main screen select the Reporticon and then the Sales Analysis icon.

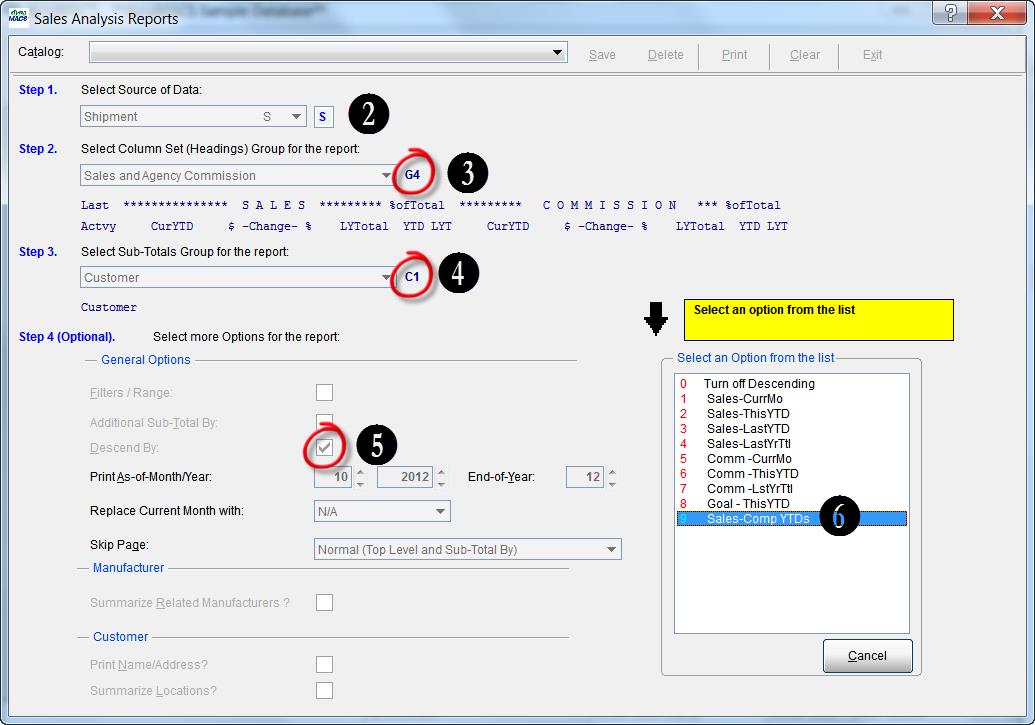
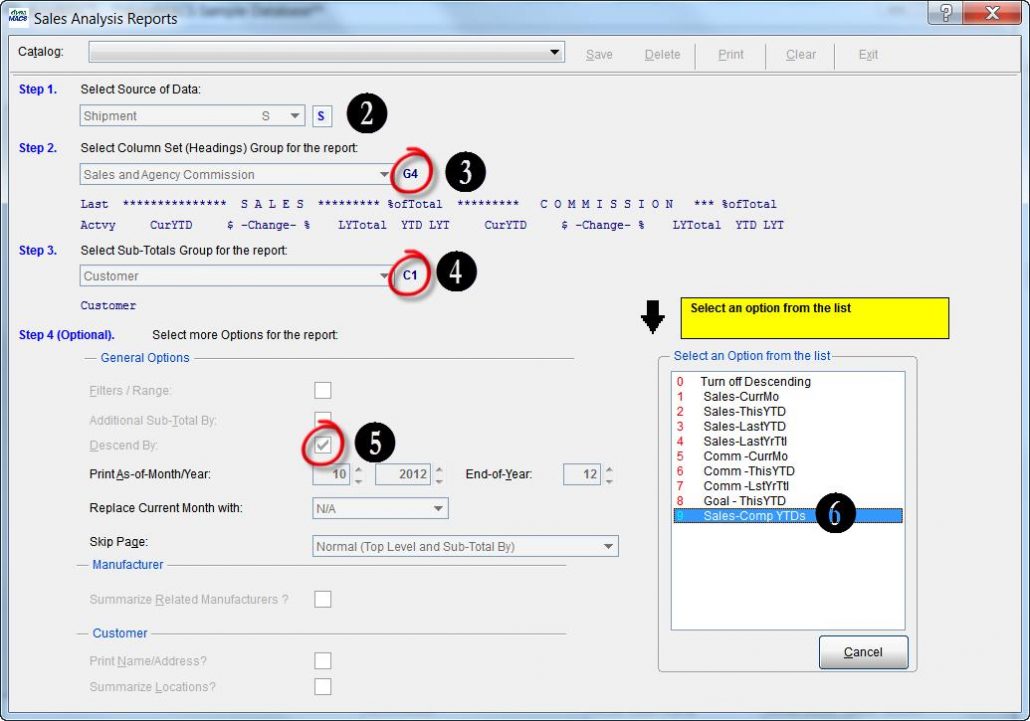
- Select Shipment for the Source of Data.
- Select the Column Set of Sales and Agency Commission then highlight G4.
- Select Sub-Totals Group of Customer then highlight C1
- Check the Descend By box
- Select Option 9 – Sales-Comp YTDs from the Descend By Options List.
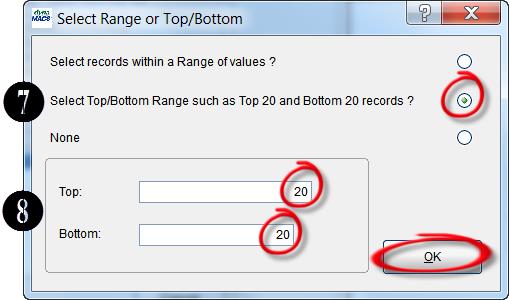
- In the Select Range or Top/Bottom dialog box select the Select Top/Bottom Range radio button.
- Enter 20 in the Top field and in the Bottom field and select the OK button.
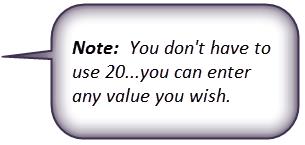
- Check the Summarize Locations box. This will combine individual locations into a total for the headquarters for customers with multiple locations.
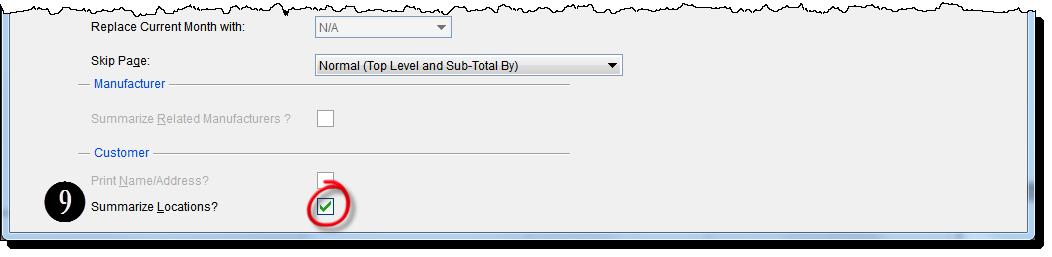
- Select the Print button.
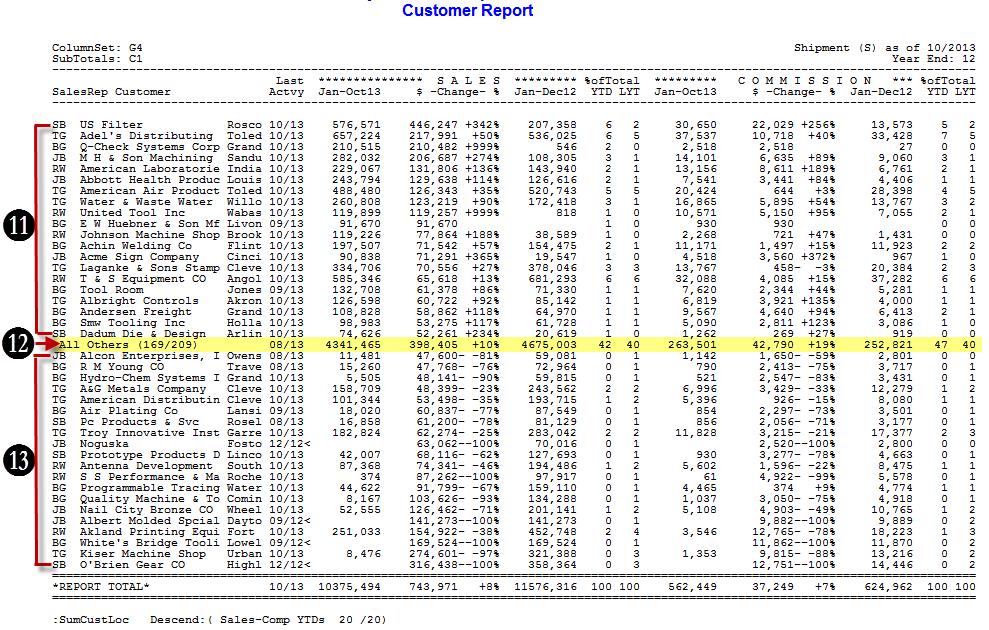
- The Top 20 customers are displayed with the greatest Y-T-D sales increase.
- A Summary of “All Other” customers is displayed
- The Bottom 20 customers are displayed with the greatest Y-T-D sales decrease.