
Page 29 - Information_Kit
P. 29
Report Generator
Generate sales & commission reports in seconds
Convert raw data into meaningful information with the click of a "We're now able to
mouse. Produce summary and/or detailed reports, and choose prepare for year-
from pre-defined formats and customizable options. end manufacturer
meetings with the
Reporting as easy as 1 – 2 – 3
click of a mouse,
1. Select the report format instead of
dynaMACS offers over 25 pre-defined formats. spending days
sorting through
2. Select the report sequence reams of paper."
Sort based on one or more of the following:
• Customer • Sales rep • State/region McCain Sales
• Branch • Customer type • Manufacturer Company, Inc.
• Customer class • Parent manufacturer • Mfg. type
• Customer division • Buying group • X-Ref Source
3. Customize the report Analyze sales…
Include/exclude records based on the values of the fields. Pay reps…
Track commissions…
Sequence to focus on the most important records – those with
the highest volume of sales or commission dollars. Simple. Powerful. Results.
Base reports on any fiscal year or go back to a prior month.
Replace Current Month amounts with variable number of
months. May be used for Quarterly analysis.
The examples below show some common questions dynaMACS reports provide the answers to:
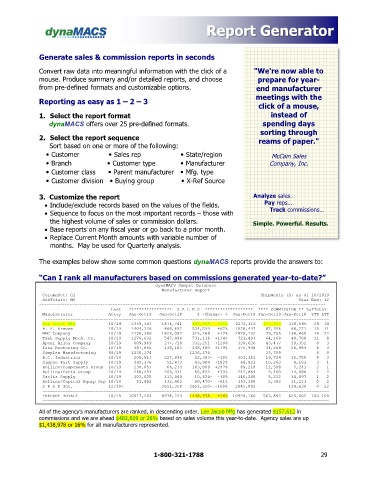
“Can I rank all manufacturers based on commissions generated year-to-date?”
dynaMACS Sample Database
Manufacturer Report
ColumnSet: G2 Shipments (S) as of 10/2019
SubTotals: M0 Year End: 12
-------------------------------------------------------------------------------------- --------------------------
Last ***************** S A L E S ******************* **** COMMISSION ** %ofTotal
Manufacturer Actvy Jan-Oct19 Jan-Oct18 $ -Change- % Jan-Dec18 Jan-Oct19 Jan-Dec18 YTD LYT
----------------------------------------------------------------------------------------------------------------
Lee Jacob Mfg 10/19 2359,347 1876,741 482,609 +26% 2272,116 157,612 128,086 28 20
H. F. Krause 10/19 1404,226 868,692 534,534 +62% 1028,447 87,356 68,271 15 11
MNC Company 10/19 2138,386 1823,097 315,289 +17% 2470,132 79,755 138,465 14 22
Task Supply Mech. Co. 10/19 1278,632 547,496 731,136 +134% 721,493 64,168 48,708 11 8
Apcal Alloy Company 10/19 609,969 277,718 332,251 +120% 320,626 43,477 19,352 8 3
Isle Restoring Co. 10/19 387,665 139,185 248,480 +179% 175,948 34,269 20,984 6 3
Simplex Manufacturing 09/19 1236,174 1236,174 33,709 6 0
B.C. Industries 10/19 208,513 227,896 22,383- -10% 303,151 19,724 15,758 4 3
Simpso Part Supply 10/19 145,376 51,473 93,904 +182% 68,823 15,263 4,163 3 1
Rollins/Components Group 10/19 230,053 66,234 163,809 +247% 89,218 11,508 7,241 2 1
Rollins/Parts Group 10/19 268,254 203,431 65,823 +33% 242,864 9,460 14,086 2 2
Saclia Supply 10/19 103,625 113,449 10,824- -10% 140,240 5,212 14,097 1 2
Rollins/Capital Equip Grp 10/19 51,992 132,462 80,470- -61% 153,108 2,382 11,211 0 2
S P & P Inc. 12/18< 2651,350 2651,350- -100% 2845,002 134,630 0 22
=================================================================================================================
*REPORT TOTAL* 10/15 10517,203 8978,224 1438,978 +16% 10920,166 563,892 625,002 100 100
=================================================================================================================
All of the agency’s manufacturers are ranked, in descending order. Lee Jacob Mfg has generated $157,612 in
commissions and we are ahead $482,609 or 26% based on sales volume this year-to-date. Agency sales are up
$1,438,978 or 16% for all manufacturers represented.
1-800-321-1788 29