
Page 31 - Information_Kit
P. 31
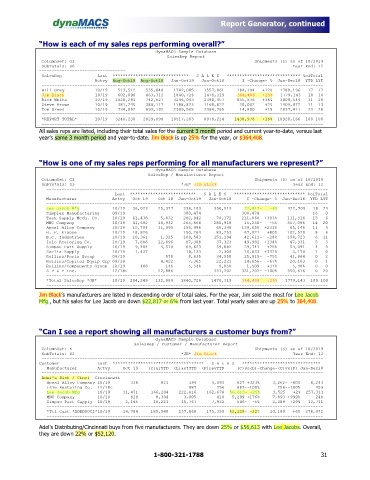
Report Generator, continued

              “How is each of my sales reps performing overall?”
                                                    dynaMACS Sample Database
                                                        SalesRep Report
               ColumnSet: G1                                                                       Shipments (S) as of 10/2019
               SubTotals: S0                                                                                      Year End: 12
              ----------------------------------
               SalesRep              Last  ******************************   S A L E S   ***************************** %ofTotal
                                    Actvy  Aug-Oct19  Aug-Oct18   Jan-Oct19   Jan-Oct18       $ -Change- %  Jan-Dec18  YTD LYT
               ---------------------------------------------------------------------------------------------------------------
               Bill Grey            10/19    513,512    535,840    1742,085    1557,861     184,194   +12%   1788,196   17  17
               Jim Black            10/19    602,090    463,312    1840,726    1476,319     364,408   +25%   1779,143   18  16
               Rick White           10/19   1020,291    742,627    3246,043    2390,457     855,576   +36%   3009,544   31  28
               Steve Brown          10/19    381,245    388,117    1188,823    1168,822      20,002    +2%   1409,872   11  13
               Tom Green            10/19    734,092    699,192    2399,565    2384,765      14,800    +1%   2837,411   23  26
               ===============================================================================================================
               *REPORT TOTAL*       10/19   3240,230   2829,098   10517,203    8978,224    1438,978   +16%  10920,166  100 100
               ===============================================================================================================
              All sales reps are listed, including their total sales for the current 3 month period and current year-to-date, versus last
              year’s same 3 month period and year-to-date. Jim Black is up 25% for the year, or $364,408.


              “How is one of my sales reps performing for all manufacturers we represent?”
                                                    dynaMACS Sample Database
                                                  SalesRep / Manufacturer Report
               ColumnSet: G1                                                                       Shipments (S) as of 10/2019
               SubTotals: S3                                          *JB* Jim Black                              Year End: 12
                 ---------------------------------------------------------------------------------------------------------------
                                            Last  **************************   S A L E S   **************************** %ofTotal
                 Manufacturer              Actvy   Oct 19    Oct 18  Jan-Oct19   Jan-Oct18      $ -Change- %  Jan-Dec18  YTD LYT
                 ---------------------------------------------------------------------------------------------------------------
                 Lee Jacob Mfg             10/19   36,023    25,377    336,103     358,919     22,817-   -6%    422,709   18  24
                 Simplex Manufacturing     09/19                       300,474                300,474                     16   0
                 Task Supply Mech. Co.     10/19   61,438     5,832    282,042      70,172    211,860  +303%    111,316   15   6
                 MNC Company               10/19   41,692    18,932    265,668     280,918     15,250-   -5%    357,096   14  20
                 Apcal Alloy Company       10/19   15,704    31,095    199,996      60,346    139,650  +231%     65,146   11   4
                 H. F. Krause              10/19   18,826              150,264      83,253     67,021   +80%    102,520    8   6
                 B.C. Industries           10/19   10,361     1,325    109,583     151,194     42,611-  -28%    198,723    6  11
                 Isle Restoring Co.        10/19    7,888    12,896     87,308      37,323     49,982  +134%     47,331    5   3
                 Simpso Part Supply        10/19    9,404     4,510     69,623      39,882     29,741   +75%     54,091    4   3
                 Saclia Supply             10/19    1,437               19,133       2,300     16,833  +732%      3,174    1   0
                 Rollins/Parts Group       09/19                578      8,635      34,550     25,915-  -75%     41,864    0   2
                 Rollins/Capital Equip Grp 09/19              4,422      7,365      22,221     14,856-  -67%     20,103    0   1
                 Rollins/Components Group  10/19      488       146      5,546       4,050      1,509   +37%      5,486    0   0
                 S P & P Inc.              12/18<            27,886                331,202    331,202- -100%    350,616    0  20
                 ---------------------------------------------------------------------------------------------------------------
                 *Total SalesRep *JB*      10/19  204,249   132,989   1840,726    1476,319    364,408   +25%   1779,143  100 100
                 ---------------------------------------------------------------------------------------------------------------

              Jim Black’s manufacturers are listed in descending order of total sales. For the year, Jim sold the most for Lee Jacob
              Mfg., but his sales for Lee Jacob are down $22,817 or 6% from last year. Total yearly sales are up 25% to 364,408.


              “Can I see a report showing all manufacturers a customer buys from?”
                                                    dynaMACS Sample Database
                                             SalesRep / Customer / Manufacturer Report
               ColumnSet: K                                                                        Shipments (S) as of 10/2019
               SubTotals: S2                                          *JB* Jim Black                              Year End: 12
               ---------------------------------------------------------------------------------------------------------------
              Customer               Last  ************************************   S A L E S   *******************************
                 Manufacturer        Actvy     Oct 19    (C)urYTD  (L)astYTD  (P)revYTD     (C)vs(L)-Change-(C)vs(P) Jan-Dec18
               ---------------------------------------------------------------------------------------------------------------
               Adel's Dist / Cinci  Cincinnati
                 Apcal Alloy Company 10/19        338         821        194      4,093     627 +323%     3,262- -80%    8,243
                 Isle Restoring Co.  12/18<                              887        256     887--100%       256--100%      459
                 Lee Jacob Mfg       10/19     11,471     166,204    222,816    162,678  56,613- -25%     3,525   +2%  257,311
                 MNC Company         10/19        810       8,304      3,005        410   5,299 +176%     7,893 +999%      248
                 Simpso Part Supply  10/19      2,165      10,221     10,767      7,932     546-  -5%     2,289  +29%   12,711
                 -------------------------------------------------------------------------------------------------------------
                 *Ttl Cust *ADED00CI*10/19     14,784     185,548    237,668    175,359  52,120- -22%    10,189   +6%  278,972
                 -------------------------------------------------------------------------------------------------------------

              Adel’s Distributing/Cincinnati buys from five manufacturers. They are down 25% or $56,613 with Lee Jacobs. Overall,
              they are down 22% or $52,120.


                                                                              1-800-321-1788                                                                  31