
Page 30 - Information_Kit
P. 30
Report Generator, continued
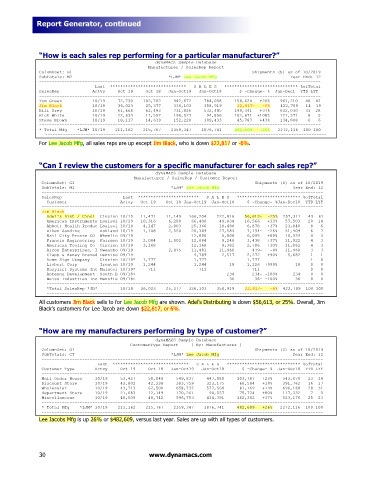
“How is each sales rep performing for a particular manufacturer?”
dynaMACS Sample Database
Manufacturer / SalesRep Report
ColumnSet: G1 Shipments (S) as of 10/2019
SubTotals: M2 *LJM* Lee Jacob Mfg Year End: 12
---------------------------------------------------------------------------------------------------------------
Last ****************************** S A L E S ***************************** %ofTotal
SalesRep Actvy Oct 19 Oct 18 Jan-Oct19 Jan-Oct18 $ -Change- % Jan-Dec1 YTD LYT
---------------------------------------------------------------------------------------------------------------
Tom Green 10/19 72,730 102,702 942,672 784,058 158,624 +20% 961,210 40 42
Jim Black 10/19 36,023 25,377 336,103 358,919 22,817- -6% 422,709 14 19
Bill Grey 10/19 61,668 62,493 731,826 532,485 199,341 +37% 632,030 31 28
Rick White 10/19 22,634 11,557 196,527 94,856 102,671 +108% 121,371 8 5
Steve Brown 10/19 18,117 14,639 152,220 109,433 45,787 +43% 134,808 6 6
---------------------------------------------------------------------------------------------------------------
* Total Mfg *LJM* 10/19 211,162 215,767 2359,347 1876,741 482,609 +26% 2272,116 100 100
---------------------------------------------------------------------------------------------------------------
For Lee Jacob Mfg, all sales reps are up except Jim Black, who is down $22,817 or -6%.
“Can I review the customers for a specific manufacturer for each sales rep?”
dynaMACS Sample Database
Manufacturer / SalesRep / Customer Report
ColumnSet: G1 Shipments (S) as of 10/2019
SubTotals: M1 *LJM* Lee Jacob Mfg Year End: 12
---------------------------------------------------------------------------------------------------------------
SalesRep Last ************************ S A L E S ************************* %ofTotal
Customer Actvy Oct 19 Oct 18 Jan-Oct19 Jan-Oct18 $ -Change- %Jan-Dec18 YTD LYT
---------------------------------------------------------------------------------------------------------------
Jim Black
Adel's Dist / Cinci Cincinn 10/19 11,471 11,149 166,204 222,816 56,613- -25% 257,311 49 61
American Instruments Louisvi 10/19 10,316 6,200 66,400 49,834 16,566 +33% 57,503 20 14
Abbott Health Produc Louisvi 10/19 4,147 2,003 25,366 18,488 6,878 +37% 23,840 8 6
Aiken Sanding Ashland 10/19 1,108 2,550 20,389 27,583 7,194- -26% 31,409 6 7
Nail City Bronze CO Wheelin 09/19 12,890 6,808 6,095 +89% 10,933 4 3
Francis Engineering Fairmon 10/19 2,084 1,002 12,684 9,246 3,438 +37% 11,922 4 3
American Tooling Co Cincinn 10/19 3,168 12,168 9,382 2,786 +30% 11,862 4 3
Alcon Enterprises, I Owensbo 09/19 2,475 11,481 11,960 479- -4% 11,960 3 3
Clapp & Haney Brazed Denniso 09/19 4,789 2,517 2,272 +90% 5,682 1 1
Acme Sign Company Cincinn 10/19* 1,777 1,777 1,777 1 0
Liebert Corp Ironton 10/19 1,244 1,244 18 1,226 +999% 18 0 0
Easylift Systems Inc Mainevi 10/19* 711 711 711 0 0
Antenna Development South B 09/18< 234 234- -100% 234 0 0
Weiss Industries Inc Mansfie 09/18< 36 36- -100% 36 0 0
-------------------------------------------------------------------------------------------------------------
*Total SalesRep *JB* 10/19 36,023 25,377 336,103 358,919 22,817- -6% 422,709 100 100
-------------------------------------------------------------------------------------------------------------
All customers Jim Black sells to for Lee Jacob Mfg are shown. Adel’s Distributing is down $56,613, or 25%. Overall, Jim
Black’s customers for Lee Jacob are down $22,817, or 6%.
“How are my manufacturers performing by type of customer?”
dynaMACS Sample Database
CustomerType Report [ By: Manufacturer ]
ColumnSet: G1 Shipments (S) as of 10/2019
SubTotals: CT *LJM* Lee Jacob Mfg Year End: 12
---------------------------------------------------------------------------------------------------------------
Last ****************************** S A L E S ***************************** %ofTotal
Customer Type Actvy Oct 19 Oct 18 Jan-Oct19 Jan-Oct18 $ -Change- % Jan-Dec18 YTD LYT
---------------------------------------------------------------------------------------------------------------
Mail Order House 10/19 53,457 50,048 549,837 447,080 103,767 +23% 543,678 23 24
Discount Store 10/19 43,802 42,338 383,759 323,175 60,584 +19% 391,762 16 17
Wholesaler 10/19 43,713 62,500 658,737 577,568 81,169 +14% 696,168 28 31
Department Store 10/19 21,683 12,149 170,261 94,537 75,724 +80% 117,332 7 5
Miscellaneous 10/19 48,509 48,742 596,753 434,391 162,362 +37% 523,176 25 23
---------------------------------------------------------------------------------------------------------------
* Total Mfg *LJM* 10/19 211,162 215,767 2359,347 1876,741 482,609 +26% 2272,116 100 100
---------------------------------------------------------------------------------------------------------------
Lee Jacobs Mfg is up 26% or $482,609, versus last year. Sales are up with all types of customers.
30 www.dynamacs.com