
Page 32 - Information_Kit
P. 32
Report Generator, continued
“Can I see a ranking of customers within a particular sales rep’s territory?”
dynaMACS Sample Database
SalesRep / Customer Report
ColumnSet: G1 Shipments (S) as of 10/2019
SubTotals: SA1 *JB* Jim Black Year End: 12
---------------------------------------------------------------------------------------------------------------
Customer Last *********************** S A L E S ************************** %ofTotal
Actvy Oct 19 Oct 18 Jan-Oct19 Jan-Oct18 $ -Change- % Jan-Dec18 YTD LYT
---------------------------------------------------------------------------------------------------------------
M H & Son Machining Sandusky 10/19 61,438 7,683 282,042 75,345 209,687 +274% 109,308 15 6
Abbott Health Produc Louisvill 10/19 18,560 32,254 243,793 84,115 159,678 +190% 88,925 13 5
Adel's Dist / Cinci Cincinnat 10/19 14,784 13,518 185,548 237,668 52,120- -22% 278,972 10 16
Ohio Conveyor & Supp Findlay 10/19 23,754 121,429 112,516 8,913 +8% 132,803 7 7
Baker Tubing Louisvill 10/19 9,772 2,130 109,542 100,682 5,860 +6% 119,315 6 7
Aerovent Cooling South Ben 10/19 13,605 14,736 103,983 132,831 29,848- -22% 170,131 6 10
E W Huebner & Son Mf Livonia 09/19 91,670 91,670 5 0
Acme Sign Company Cincinnat 10/19 1,777 26 90,838 18,559 72,279 +389% 18,559 5 1
Antenna Development South Ben 10/19 5,476 4,923 87,368 161,709 74,341- -46% 194,486 5 11
Machine Shop Massillon 10/19 6,861 11,696 76,181 34,976 41,208 +118% 45,479 4 3
All Others (30/40) 09/19< 47,223 46,033 452,342 517,918 65,576- -13% 622,169 25 35
---------------------------------------------------------------------------------------------------------------
*Total SalesRep *JB* 10/19 204,249 132,989 1840,726 1476,319 364,408 +25% 1779,143 100 100
---------------------------------------------------------------------------------------------------------------
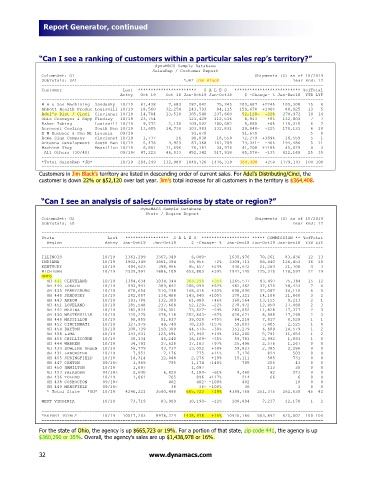
Customers in Jim Black’s territory are listed in descending order of current sales. For Adel’s Distributing/Cinci, the
customer is down 22% or $52,120 over last year. Jim’s total increase for all customers in the territory is $364,408.
“Can I see an analysis of sales/commissions by state or region?”
dynaMACS Sample Database
State / Region Report
ColumnSet: G2 Shipments (S) as of 10/2019
SubTotals: L0 Year End: 12
---------------------------------------------------------------------------------------------------------------
State Last ***************** S A L E S ******************* ***** COMMISSION ** %ofTotal
Region Actvy Jan-Oct19 Jan-Oct18 $ -Change- % Jan-Dec18 Jan-Oct19 Jan-Dec18 YTD LYT
---------------------------------------------------------------------------------------------------------------
ILLINOIS 10/19 1361,299 1367,349 6,080- 1635,976 70,261 83,436 12 13
INDIANA 10/19 1902,349 1861,394 39,955 +2% 2309,711 88,440 126,453 16 20
KENTUCKY 10/19 494,623 398,966 95,657 +24% 436,672 21,264 21,708 4 3
MICHIGAN 10/19 2339,991 1686,109 653,883 +39% 1941,145 125,315 118,597 22 19
OHIO
OH 441 CLEVELAND 10/19 1384,634 1034,344 360,290 +35% 1265,577 83,497 75,384 15 12
OH 440 LORAIN 10/19 593,941 389,842 205,099 +52% 482,462 37,675 38,433 7 6
OH 435 PERRYSBURG 10/19 678,654 510,238 168,416 +33% 698,096 32,087 34,110 6 5
OH 448 SANDUSKY 10/19 282,057 138,408 143,640 +105% 178,321 14,108 11,860 3 2
OH 443 AKRON 10/19 193,788 132,309 61,480 +46% 160,564 13,155 9,213 2 1
OH 451 LOVELAND 10/19 185,548 237,668 52,120- -22% 278,972 12,450 17,080 2 3
OH 442 MEDINA 10/19 182,824 256,351 73,527- -29% 283,052 11,828 17,377 2 3
OH 430 WESTERVILLE 10/19 125,275 378,118 252,843- -67% 428,671 8,998 17,268 2 3
OH 446 MASSILLON 10/19 90,855 51,837 39,028 +75% 64,218 7,817 6,529 1 1
OH 452 CINCINNATI 10/19 127,979 49,749 78,230 +157% 58,083 7,405 2,525 1 0
OH 454 DAYTON 10/19 108,739 150,309 44,570- -30% 151,279 6,689 14,579 1 2
OH 458 LIMA 10/19 143,631 125,691 17,940 +14% 162,200 5,791 11,054 1 2
OH 456 CHILLICOTHE 10/19 30,134 46,240 16,109- -35% 59,781 2,992 1,891 1 0
OH 444 WARREN 10/19 34,791 17,628 17,163 +97% 25,496 2,576 1,267 0 0
OH 434 BOWLING GREEN 10/19 56,779 43,737 13,052 +30% 59,823 2,385 2,286 0 0
OH 431 LANCASTER 10/19 7,951 7,176 775 +11% 7,176 824 503 0 0
OH 455 SPRINGFIELD 10/19 14,314 12,048 2,276 +19% 15,111 585 731 0 0
OH 447 CANTON 09/18< 1,969 795 1,174 +148% 795 256 41 0 0
OH 450 HAMILTON 10/19 1,097 1,097 113 30 0 0
OH 453 FAIRBORN 04/18< 2,640 6,820 4,180- -61% 9,460 92 473 0 0
OH 436 TOLEDO 10/19 1,661 765 896 +117% 214 66 6 0 0
OH 438 COSHOCTON 09/18< 402 402- -100% 402 10 0 0
OH 449 MANSFIELD 09/18< 36 36- -100% 36 1 0 0
* Total State *OH* 10/19 4246,221 3580,498 665,723 +19% 4389,768 251,375 262,630 45 42
WEST VIRGINIA 10/19 73,719 83,909 10,190- -12% 108,894 7,237 12,178 1 2
===============================================================================================================
*REPORT TOTAL* 10/19 10517,203 8978,224 1438,978 +16% 10920,166 563,892 625,002 100 100
===============================================================================================================
For the state of Ohio, the agency is up $665,723 or 19%. For a portion of that state, zip code 441, the agency is up
$360,290 or 35%. Overall, the agency’s sales are up $1,438,978 or 16%.
32 www.dynamacs.com