Posts

Tip #1206 – dynaMACS Quarterly Tax Reporting

In dynaMACS Sales IQ you can retrieve quarterly commission numbers which can assist you in expediting your tax reporting.  If you need to report by state, you can do so by using the Sales Analysis reports feature OR filter by state/region in Sales IQ.

Sales IQ Agency Comm (3Mos) – Example

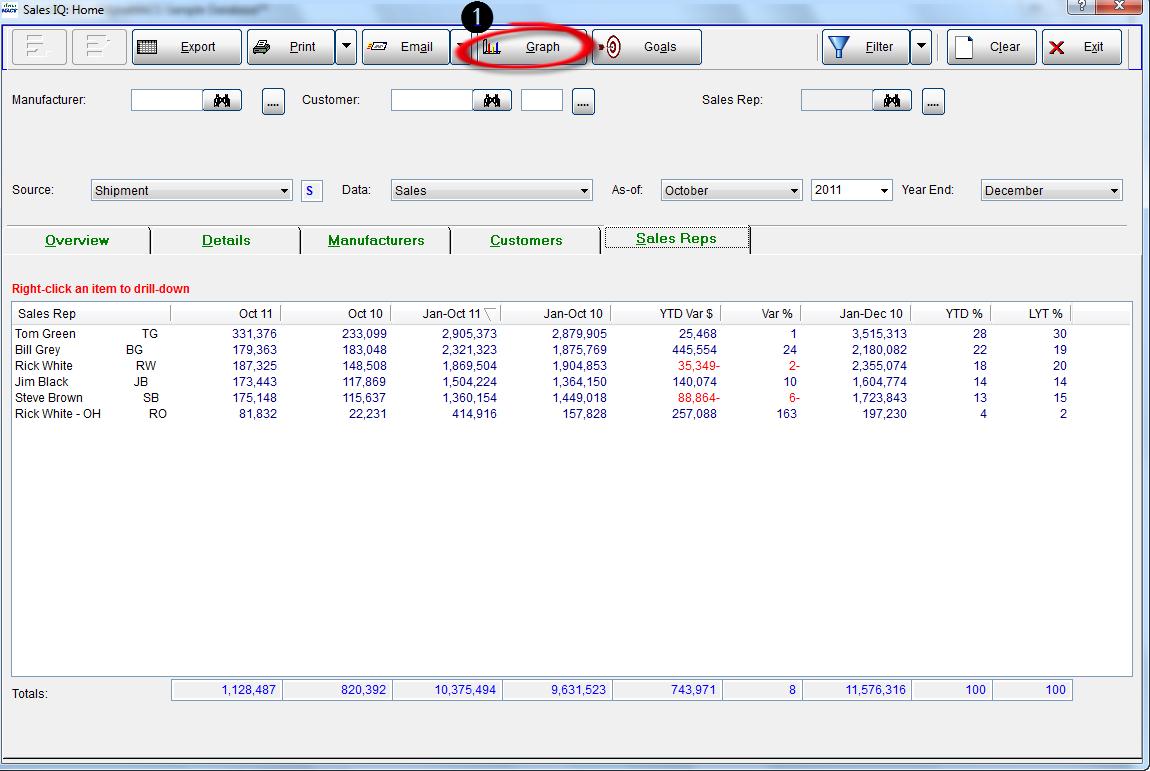
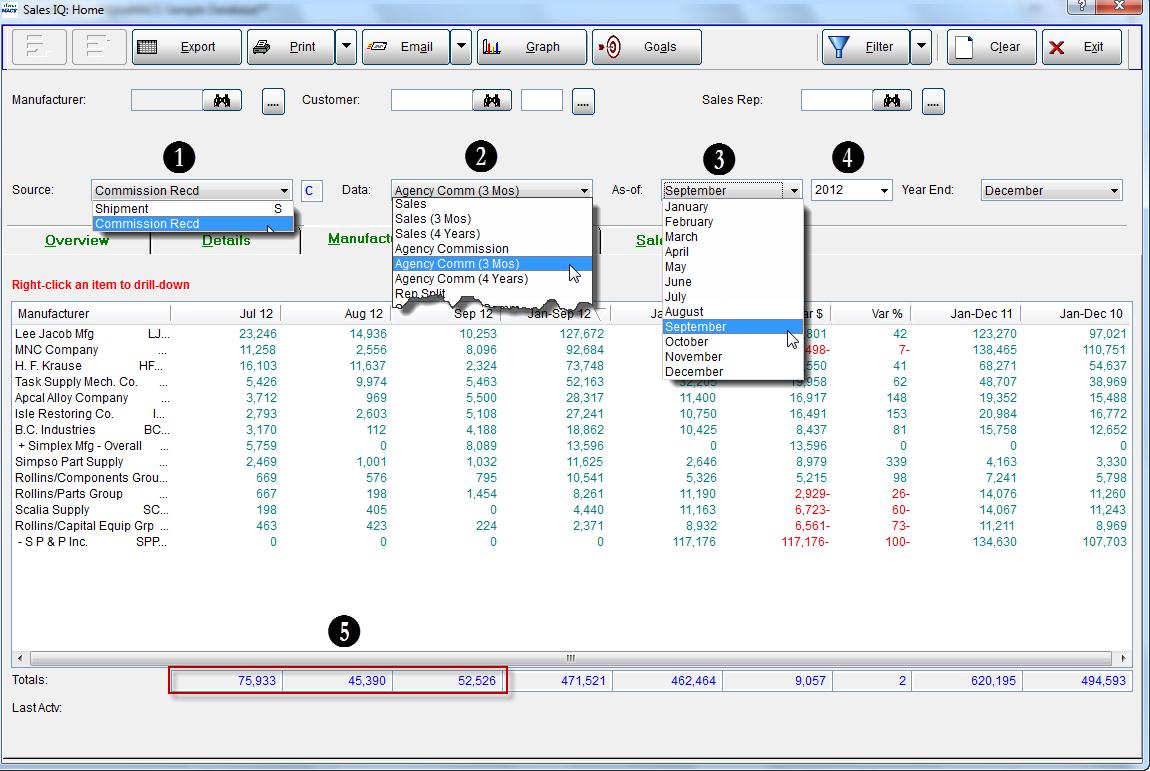
In the following example we will generate a report using Sales IQ for quarterly commissions by manufacturer for commissions received July – September 2012.

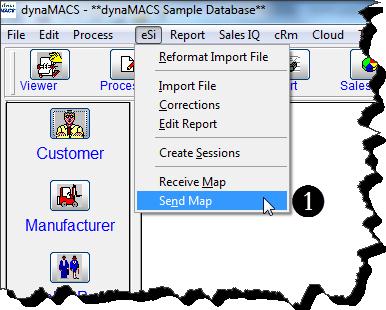
  1. From Manufacturers tab in the Sales IQ screen select Commissions Received from the Source drop down list.Note: If you do not have the Commission Reconciliation module then you can pull the data from Shipments vs. Commissions Received.
  2. Select the Agency Comm (3 Mos)option from the Data drop down list.
  3. Select September from the As-of drop down list.
  4. Select 2012 for the As-of year from the drop down list.
  5. The quarterly commissions received will appear in the column Totals for Jul 12, Aug 12,u Sep 12.Sales IQ Home

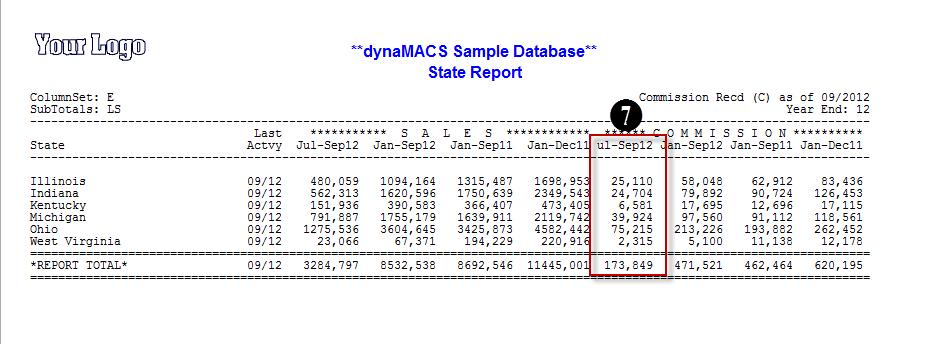
Sales Analysis Commission Received by State – Example

In the following example we will generate a report using Sales Analysis for quarterly commissions by state for commissions received July thru September 2012.

  1. Select Commission Rec’d from the Selected Source of Data drop down list box.Note: If you do not have the Commission Reconciliation module then you can pull the data from Shipments vs. Commissions Received.
  2. Select Sales and Agency Commission from the Select Column Set (Headings) drop down list box.
  3. Select Customer State/Region from the Select Sub Totals Group drop down list box.
  4. Enter 09 and 2012 in the Print As-of Month/Year
  5. Select 3 Months from the Replace Current Month With drop down list box.
  6. Select the Print button.Sales Analysis Reports
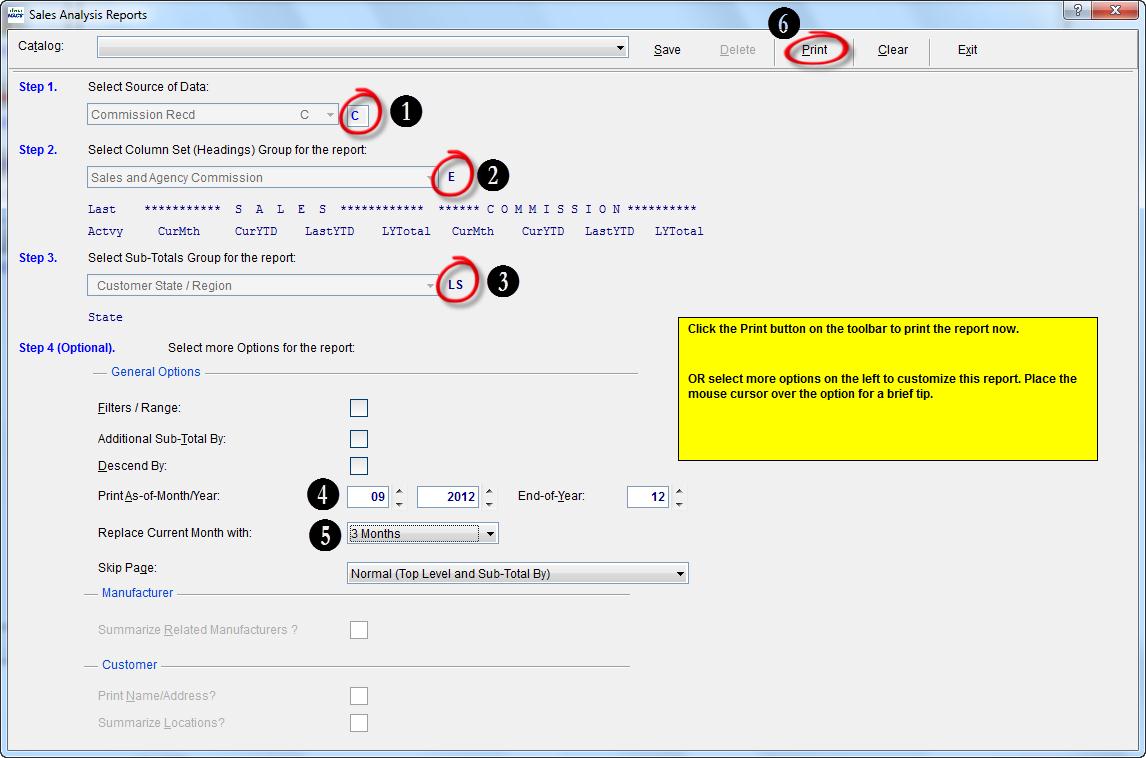
  7. The following report is displayed showing the commissions received for Jul – Sept 12 by state.State Report

Case Study: PG Tool Sales Agency, LLC

“dynaMACS is always innovating and continually enhancing the software. I would recommend dynaMACS to anyone.”

Diane Geiger, Treasurer / Inside Sales
PG Tool Sales Agency

PG_Tool_LogoClient Challenge

PG Tool Sales Agency had been a customer of dynaMACS’ predecessor, MACS software, since 1989. When dynaMACS was introduced in 2003, PG Tool didn’t hesitate to upgrade. “We’d been happy with the software from the beginning. When dynaMACS came out, we wanted to have the newest product – the latest and greatest version,” says Diane Geiger, Treasurer and Inside Sales Director for PG Tool. “We went with dynaMACS because of our good track record with MACS – and we are glad we did. It’s been great.”


PG_Tool_StatisticsdynaMACS Solution

In fact, long-time customers like PG Tool have helped make dynaMACS the most powerful, easy-to-use software on the market. “The dynaMACS team is very open to input. They’ve listened to our feedback over the past 25 years, and they constantly work to improve the product based on how sales agencies like ours use the software on a day-to-day basis. dynaMACS is truly designed for professional sales agencies that need multi-level sales and commission analysis,” Geiger says.

Geiger says dynaMACS delivers intelligence on customers and manufacturers that help the sales team be more effective. “We can recognize trends by customer, manufacturer and sales reps. This helps us determine the types of promotions to offer based on the income generated. It also helps with up-sells and cross-sells.

The agency also knows who is not buying, or whose purchasing has dropped off, so salespeople can spend their time on the accounts that need the most attention. Salespeople can use their time more efficiently, by sorting customers by zip code, analyzing sales and setting up call days and planning the most efficient routes.  

What’s next? PG Tool is preparing to step into the next-generation of innovation. dynaMACS recently introduced processing on the Cloud. PG Tool will be among the first dynaMACS customers to process on the Cloud. This gives salespeople access to real-time data that is accessible from anywhere, on most smart devices, like smart-phones and tablets, at any time.

Case Study: J T Chapman Company

“Knowing where sales & commissions are day-to-day keeps us at the pulse of the business.”

Alan Chapman
J.T. Chapman Company

JT_Chapman_CompanyClient Challenge

J.T. Chapman calls its old software “stagnant.” The data was static, with no ability to “slice and dice” information, segment data or drill down for more details. Furthermore, the agency could not gauge sales throughout the month because they had to wait until the month-end closing procedure was finished before seeing updated numbers.


JT_Chapman_Company_StatisticsdynaMACS Solution

Today, J.T. Chapman is happy to report that dynaMACS addresses each of these issues – and more. “dynaMACS gives us the flexibility that we were lacking,” says Alan Chapman. “We can drill down to get more detailed information from any screen and we can select any combination of manufacturer, customer or sales rep,” which enables the sales agency to view and analyze numbers in a multitude of ways.

dynaMACS enables the agency to select data for any previous point in time, view sales and commissions for the past five years, and compare sales information to any prior month or year.

Chapman also points out, “Waiting for month-end for sales numbers is a thing of the past. Knowing where we are day to day keeps us at the pulse of the business.”

J.T. Chapman has dynaMACS Mobile for all of its salespeople, and Chapman says, “My top salesman looks at numbers every day. It helps him do his job more effectively.”

Another feature that helps J.T. Chapman is the ability to manipulate numbers based on fiscal year. “Our fiscal year runs October to September, but if a manufacturer or customer is on a calendar year, I can click a button and match theirs.”

Asked how his old software (CAS) compares with dynaMACS, Chapman laughs, “There’s no comparison.”

Tip #1205 – Did you know that you can share eSi data maps with other agencies that are using dynaMACS eSi?

If you share a manufacturer with another agency that uses dynaMACS eSi, you can easily exchange data maps without the risk of sharing your agency data.  Using the Send Map and Receive Map* options in dynaMACS will eliminate having to create new maps.  The following examples will explain how to send and receive maps to and from other agencies.

Sending a Map to another Agency

Sending a map to another agency requires that you have created and saved a map in dynaMACS eSi.

  1. From the dynaMACS main menu, select eSi then Send Map from the drop down menu.Main Screen 1
  2. From the Export Catalog dialog box select the file to be exported
  3. Select the Export button.eSi Import Catalog Record
  4. The file location of the exported map will be displayed in the FYI dialog box.  Select the OK button.FYI Diolog Box 2
  5. Once the file has been exported you can email it to the agency that you are sharing it with.

Case Study: Kelly Mincks

“When comparing dynaMACS and our old software, the screens are easier, the report format is more useful and the networking capability is more convenient.”

Bill Kelly, Partner
Kelly-Mincks

Kelly_Mincks_LogoClient Challenge

As part of re-structuring after a failed merger, Kelly-Mincks decided it was time to take a look at the agency sales software, to see if it could be better serving the agency and its operations. The agency compared its old software and a competitor side-by-side. How did the softwares stack up?

Kelly_Mincks_StatisticsdynaMACS Solution

“For me, personally dynaMACS is a better system,” says Partner Bill Kelly. He surmised that “the screens are easier, the report format is more useful and the networking capability is more convenient.” Plus, dynaMACS has a feature that Kelly-Mincks’ old software didn’t have: mobile, the ability for sales rep to take sales and commission information with them on the road.

Kelly-Mincks has 3 mobiles for its sales team, and each rep can access sales and commission data for his territory at any time. The reps’ information is as up-to-date as the offices’. “We really like the ease of getting information out to the laptops,” Kelly says.

Furthermore, dynaMACS is installed on the agency’s network, to allow access by all users at different computers. “Previously, we only had access from one computer, so one person couldn’t be printing reports if another was entering data,” Kelly explains. Due to the powerful reporting and analysis capabilities of dynaMACS, the agency decided that multiple users would need to access dynaMACS concurrently.

Kelly also likes the reporting functionality. “Converting raw sales data into meaningful information is easy.” With dynaMACS’ powerful report generator, Kelly-Mincks can produce summary or detailed reports and choose from pre-defined or customizable formats. The agency creates the reports it needs from thousands of possible combinations. Activity is viewed in many different ways from viewing commission expected to comparing sales this year against last or viewing total agency performance by sales rep.

Tip #1204 – Getting More out of Your Sales IQ Graphs

As you know, dynaMACS Sales IQ has powerful graphing capabilities. You can create a colorful graph for virtually any combination of information that is available to you in Sales IQ. Here are a couple of things to increase your graphics experience.

  • The ability to change the default title of your graph
  • Using the Copy to Clipboard feature which allows you to paste your graph into an email, Microsoft Power Point presentation, Microsoft Word document, or any other word processing document.

The following tips will help you better understand how to use these Graph features in dynaMACS.

Changing the Default Title on a Graph

In the following example we have selected the Sales IQ button and then selected Sales Reps tab.

  1. Select the Graph button from the Sales IQ screen.Sales IQ Home
  2. After selecting the data to be included in the graph, override the default Graph Title with the desired title.
  3. Select the Graph button.Select Columns To Graph
  4. You will see the newly created graph with the overridden Graph Title.Sales IQ Graph

Copy to Clipboard Feature

The dynaMACS graphing feature allows you to copy and paste any graph that you have created in dynaMACS into an email or other document.

  1. From the Sales IQ Graph screen select the Customize button.Sales IQ Graph 2
  2. In the Customize Graph screen select the System tab.Customize Graph
  3. Select the desired Format.
  4. Select Clipboard for a target.
  5. Select the Copy button.Export Image
  6. Your graph is now on the clipboard and ready for pasting into the desired document by using that applications paste function (or by using Ctl V on your keyboard while in the application.)