Posts

Tip #1511 – Transferring History to Current Sales Rep

Enhanced Sales Rep Transfer

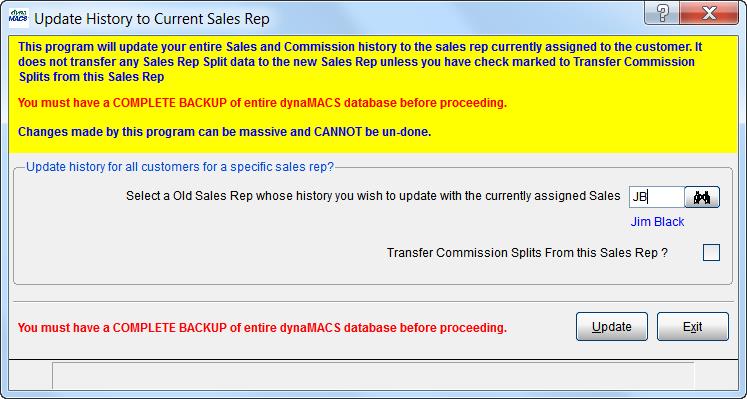
The Transfer Sales Rep History has been enhanced and moved to the Manufacturer/Customer/Sales Rep Transfer/Combine 1 screen.  In previous versions of dynaMACS selecting the Update History to Current Sales Rep from the Edit>File Transfer/Combine menu would launch the following screen:

Update History Old Screen

In dynaMACS 2015

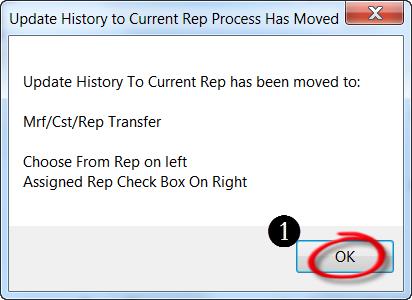
  1. In dynaMACS 2015 when selecting the Update History to Current Rep from the Edit>File Transfer/Combine menu the following dialog box will now appear.  Select the OK button which will reroute you to the Manufacturer/Customer/Sale Rep Transfer/Combine 1 screen to complete the transfer of sales rep history.

Update History Has Moved


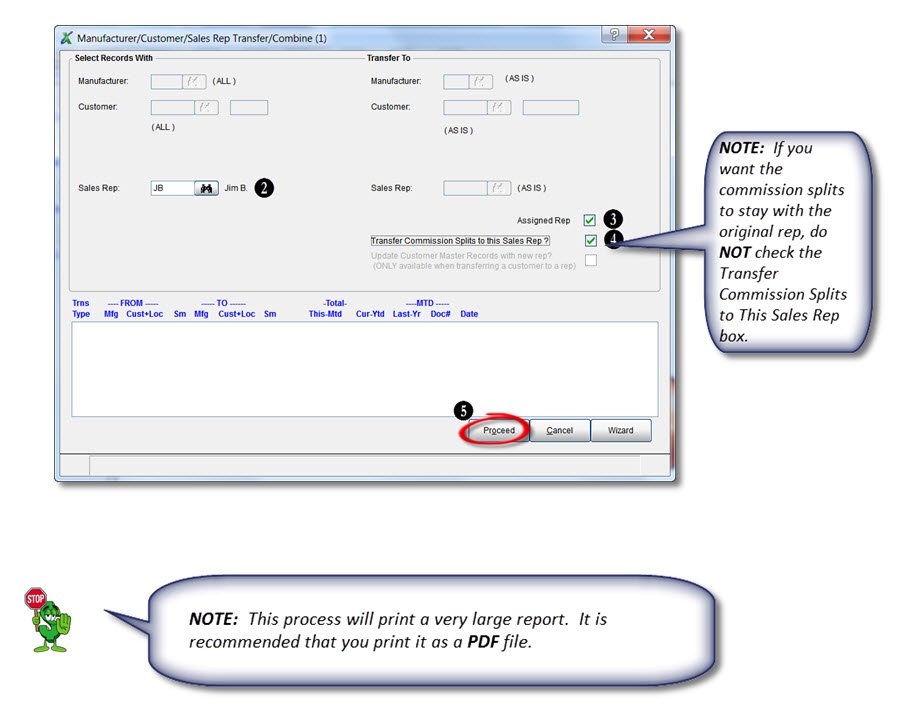
2.  Enter the previous Sales Rep code in the Sales Rep field on the left hand side of the screen.

3. Check the Assigned Rep box.

4. If there are commission splits to be transferred, select the checkbox for Transfer Commission Splits to this Sales Rep?

5.  Select the Proceed  button to complete the transfer.

Transfer Combine Screen with Notes


Case Study: BNT Sales Agency Limited

 “Before buying software, I did my homework. For every question or need I had, dynaMACS had a solution.”

Wade Wohlford, President / Welding Specialist
BNT Sales Agency

BNT_Sales_Agency_LogoClient Challenge

Spreadsheets used to be the rudimentary but necessary tool for BNT Sales Agency to track agency performance. The utilitarian process was time-consuming and limiting, showing only basic information. BNT needed more: the ability to see in-depth, organized sales and commission information.

When Wade Wohlford, President of BNT Sales Agency, saw a demonstration of dynaMACS at a trade show, he saw a world of opportunity; a wealth of sales and commission data at his disposal anytime – and the ability to see the agency in ways never before possible.


BNT_Sales_Agency_StatisticsdynaMACS Solutions

“I did my homework, comparing various brands of software. For every question or need I had, dynaMACS had a solution,” Wohlford says.

dynaMACS combines sales and commission information for all manufacturers, customers and sales reps in one database. Sortable, filterable data enables Wohlford and his team to see exactly the information they need, in the ways they want to see it.

With the ability to view data, sorted by manufacturer, customer or sales rep – and much more, “I can look at a quick snapshot of customer and manufacturer numbers, or analyze in-depth data,” he says. Wohlford sees which territories are up or down, “We can identify which product lines to focus on.”

Wohlford says he also looks at year-over-year data, comparing this year to last for a full understanding of agency performance.

When it comes to analyzing sales, paying reps and tracking commissions, dynaMACS went beyond meeting BNT Sales Agency’s individual and specific needs. It changed the way agency operates.

Tip #1510 – Newly Enhanced Graphing Features in 2015

dynaMACS has made the graphing capability easier than ever.  We have created an instant graph option and a simpler way of placing the graph in other software.  The following outlines the changes to this feature.

Quick Graph

In dynaMACS 2015 you have the option for a Quick Graph which will directly open up a graph based on the selections in the Sales IQ screen.  This is now the default for the Graph button.

  1.  From the Sales IQ screen, click on the Graph button or the Down Arrow next to the Graph button and then select Quick Graph.
  2. The Graph screen will appear displaying the information based on the selections that were made in the Sales IQ screen.Graph Screen with Note

Graph

You can also use the regular graphing feature to change column headings and the graph title.

1.  From the Sales IQ screen, click on the Down Arrow next to the Graph button and then select Graph.
Graph Button


2. This feature will display the Select Columns to Graph screen where you can change the default column headings for your graph.

Columns to Graph

Graphs Can Now be Easily Copied to Clipboard

Copying the graph has never been easier.  By selecting the Copy to Clipboard button while in the Graph screen the graph will be copied to the clipboard and you can easily paste it into any document.

Sales IQ Graph - Copy to Clipboard


Tip #1509 – Using dynaMACS’ Sales IQ to compare Sales and Agency commission for 3 months

This tip will demonstrate a quick way to view and compare your individual monthly sales and agency commission numbers for 3 consecutive months by using the dynaMACS Sales IQ feature.

Example:

In the following example we will show the last three months of sales and agency commission data for all manufacturers as of September 2015.

  1.  With the Manufacturers tab selected in the Sales IQ screen, select Sales + AgyComm (3 Mos) from the Data drop down list.
  2. Select September 2015 in the As-of drop down list.
    SIQ Screen 1
  3. The first three columns display sales and commission data for July 2015.
  4. The second three columns display sales and commission data for August 2015.
  5. The third three columns display sales and commission data for September 2015.
    SIQ Screen 2

Case Study: The Henson Sales Group, Ltd.

 “dynaMACS is sophisticated. It creates operational efficiencies and delivers extremely detailed data.”

Alicia Bucci, Office/Operations Manager
Henson Sales Group Ltd.

HensonSalesGrp_LogoClient Challenge

Henson Sales Group was spending too much time on manual tasks related to sales and commissions data. Many of the agency’s factories pay on Trace (point of sale) reports but the old software had limited capabilities and captured only basic data. The agency needed more: more efficiency, more access and more detailed data, explains Office and Operations Manager Alicia Bucci. It was also important that everyone in the organization have access to current information.

HensonSalesGrp_StatisticsdynaMACS Solution

dynaMACS was implemented on the cloud, which gives everyone access to real-time data anytime, anywhere from most smart devices. When Henson Sales Group began using dynaMACS, the agency noticed extremely advantageous improvements:

*The agency can drill down for details – in hundreds of ways – covering all facets of sales and commission. For example: View customers in a sales rep’s territory ranked in descending order by year-to-date sales. Or, a few clicks deliver a 5-year sales history for any manufacturer or customer.

*Manual data entry tasks that used to take hours are completed in seconds, with a few quick clicks using dynaMACS eSi.

*With dynaMACS Mobile, sales reps have access to the most up-to-date data from any Internet-enabled device.

*Sales reps slice and dice information in the ways that are most useful to them for evaluating their territory.

*Customer meetings are more engaging and productive. Sales reps share reports on lines that are down, and by how much.

*Sales reps are able to see complete details for their territory, but unable to see numbers for other territories.

*To assist with compensation, dynaMACS automatically splits commissions among sales reps.

dynaMACS delivered Henson Sales the functionality needed for efficiency and access to comprehensive data.

Tip #1508 – Did you know about this Simple Way to Get Quarterly Sales Numbers in dynaMACS?

This tip will demonstrate a very simple and quick way to get your quarterly sales numbers by using the dynaMACS Sales IQ feature.

In the following example we will show the last three months of sales data for all manufacturers.

  1.  With the Manufacturers tab selected in the Sales IQ screen, choose 3 Months in the Current Period (CP) drop down list in the Parameters section.
  2. Select September 2015 in the As-of drop down list.
  3. The first column now displays data for the selected 3 month period of Jul-Sep 15 (current year).
  4. The second column displays data for the selected 3 month period of Jul-Sep 14 (prior year).SIQ Screen

Note