Posts

Why CRM for dynaMACS Customers?

Manufacturers’ representatives use CRM to stay competitive and to have one central place for everyone to stay on the same page. They use CRM to keep manufacturers informed about what they are working on and the value that they provide as a partner. Manufacturers hire the best rep first and the best reps firms use CRM to manage their customer information.

You can:

  • Create or update sales call notes
  • Opportunities
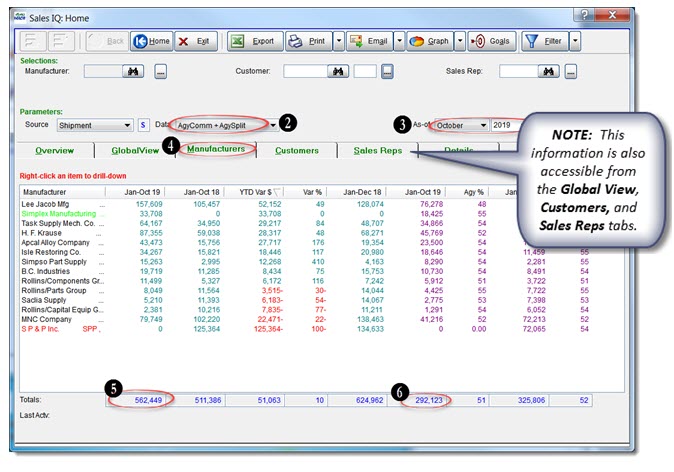
  • Review Sales numbers
  • Look up Quotes
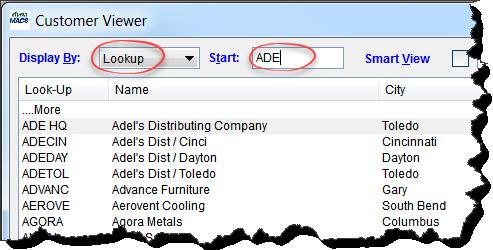
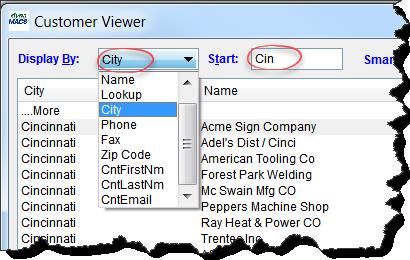
  • Keep your customer contact information up to date

If you’re going to have a CRM, have one that’s designed for a rep firm. Empowering Systems AccountManager is just that, a sales solution designed for you and how you work, from your phone, from your inbox, offline or online.

Email April to learn more

or get a link to a demo.

Stop phishing emails in their tracks

Do you know when you’ve received a phishing or spoofing email? Your first line of defense against phishing emails is to have a 3rd party anti-virus solution between your email and the outside world. Even with having the additional anti-virus some of these malicious emails will get through.  Here are a few tips to identify if you’ve gotten a phishing email:1. Be cautious about opening attachments or clicking on links in emails. Even your friend or family members’ accounts could be hacked. Files and links can contain malware that can weaken your computer’s security.

2. Do your own typing. If a company or organization you know sends you a link or phone number, don’t click. Use your favorite search engine to look up the website or phone number yourself. Even though a link or phone number in an email may look like the real deal, scammers can hide the true destination.

3. Turn on two-factor authentication. For accounts that support it, two-factor authentication requires both your password and an additional piece of information to log in to your account. The second piece could be a code sent to your phone, or a random number generated by an app or a token. This protects your account even if your password is compromised.

See this great blog post, it’s older but is more relevant than ever: “10 Tips on How to Identify a Phishing or Spoofing Email” by Lauren Harris from Return Path to learn more.

Tip #1711 – Import your Sales Goals Quickly with the dynaMACS Optional Module – eSi

Save hours of manual entry by exporting your sales data out of Sales IQ, manipulate the annual number and simply import your sales goals for the next year back into dynaMACS.

Export your sales numbers out of Sales IQ

  1. From the Sales IQ screen enter in a sales rep that you would like to create goals for.
  2. Select the GlobalView Tab.
  3. Select ALL from the Selector drop-down list.
  4. Wait for dynaMACS to process your request.
  5. Select the Export button.
  6. Name the file and place it in a directory that you will remember where it is located.
  7. Exit out of Sales IQ.
  8. Find the file that you just saved. Double click on it and the file will open in Excel.
  9. Insert a column next to the Sales Jan-Dec 17 column (F) and name it Goals.
  10. Create the formula with the percent that you would like to change. (Example shows 15%).
  11. Copy the formula down the spreadsheet and save it as a csv file.
  12. Go into the eSi reformat screen for dynaMACS.
  13. Map the Goals.
  14. Process through the rest of the eSi steps.
  15. NOTE: Make sure that you are posting the session to January of the year that you want the goals to go into. (Example:  01/2018)

Tip #1709 – Using dynaMACS’ Sales IQ Graph to Show the difference in “House” Commission percentages for this year versus last year

In our previous tip #1708 we talked about using dynaMACS’ Sales IQ to analyze “House” commission. The following will show you how to create a graph from that information.

Using the Graphing Feature in dynaMACS

  1.  From the Sales IQ screen select the Filter button.
  2.  Select Active from the Manufacturer Status drop down list.
  3.  Select the Apply button.
  4. From the Sales IQ screen with your selections displayed, click on the down arrow to the right of the Graph button and select Graph.
  5. Check the boxes for Jan-Aug 19 and Jan-Aug 18 in the Select Columns to Graph screen.
  6. Once you have made your selections click on the Graph button in the lower left hand corner of the screen.
  7. The graph will default to a bar chart.  Select the Customize button to change the type of graph that will appear.
  8. Select the Line chart (or Pie etc.) to customize the look of your graph.
  9. When you have completed your selections select the OK button.

From the Sales IQ Graph screen you can:

  1.  Print the graph.
  2. Customize the look of the graph.
  3. Copy to Clipboard.

Tip #1708 – Using dynaMACS’ SalesIQ to Analyze “House” Commissions

dynaMACS’ Sales IQ provides a unique method for analyzing your agency sales and commission numbers.  House commissions are the agency commissions remaining after paying all the sales reps their split of the commissions.

Use the “Data” Control to Display Your “House” Commissions.

In the following example we show data for Agency Commission + Agency Splits listed by manufacturer as of October 2019.  This allows you to examine the total agency commissions and the remaining “House” commissions.

  1.  From the dynaMACS main screen, select the Sales IQ button.
  2.  Select AgyComm + AgySplit from the Data drop down list in the Parameters section of the screen.
  3. We have selected October 2019 from the As-of drop down list in the Parameters section of the screen.
  4. Select the Manufacturers tab.
  5. This column represents the total agency commission amount for Jan-Oct 2019.
  6. This column represents the total agency “House” commission amount for Jan-Oct 2019 after paying the sales reps.

Tip #1706 – Are you constantly changing the “display by” search in the customer viewer?

The Display By field in the dynaMACS Viewer screens defaults to “Lookup” which lets you enter the first few characters of the Name i.e. manufacturer, customer or sales rep name in the Start field which will display a list based on that entry.

You can change this default temporarily by selecting the down arrow in the Display By field while in the Viewer screen.  This will change the Display By for the current viewing session.

You can also change the default so that every time you access the Viewer screens it will default to your personal selection.

To Change the Default Display By Field for the Viewer Screens

  1.  From the main dynaMACS screen select File>Preferences.

  2. From the User Preference(s) screen, scroll down to #19 Viewer Look-Up.
  3. Select the drop down arrow to the far right of Viewer Look-Up.
  4.  Select the field which you would like your default Viewer Look-Up to be ( i.e. City).
  5. Select the Save button.
  6. Select the Exit button.

Now when you access any of the viewer screens the Display By field will default to that selection.