Tip #1601 – Looking up and Changing Information “on-the-fly” in Sales Entry

dynaMACS provides the ability to look up detailed information, make changes or add a location  “on-the-fly” during sales entry.

Example:

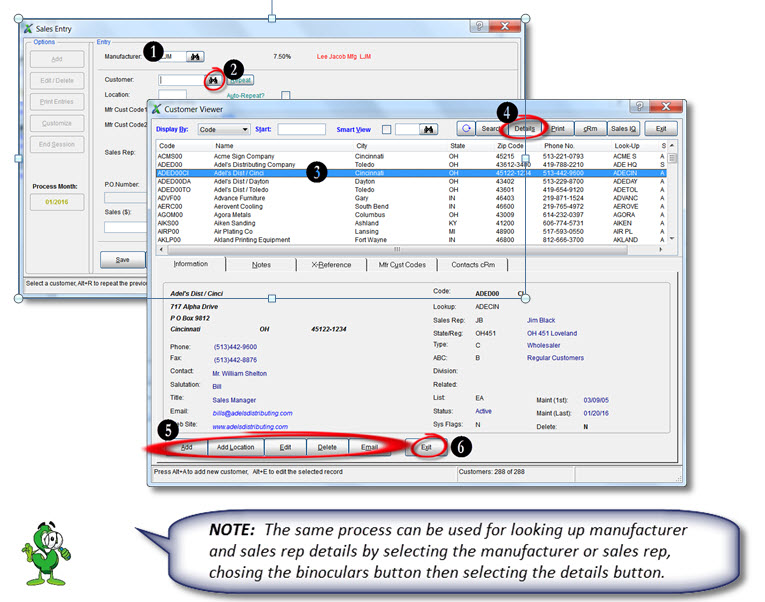
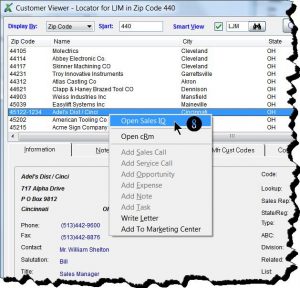
In the following example we will look up the details of the Customer Adel’s Dist/Cinci while in the Sales Entry screen.

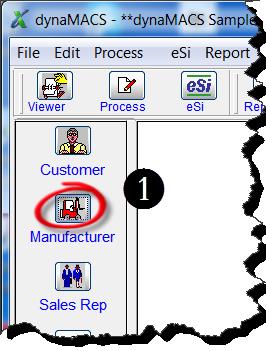
  1.  From the Sales Entry screen enter the Manufacturer code.  For this example we will use LJM.
  2. Select the look up button next to the Customer field which will open the Customer       Viewer screen with all customers for the selected manufacturer displayed.
  3. Highlight the customer.  For this example we will select Adel’s Dist/Cinci.
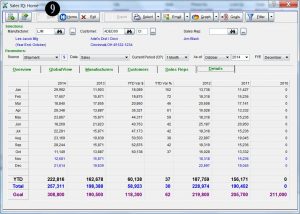
  4. Select the Details button.  This screen will display all of this customer’s details.
  5. You may make additions or modifications.
  6. To return to the Sales Entry screen, select the Exit button at the bottom of the screen.

Sales Entry-Cust Viewer-Note

Tip #1512 – Finding Customers for a Certain Manufacturer Easily Using the Smart View Locator

You can find customers in a zip code that buy from a particular manufacturer by using the Smart View Locator from the Manufacturer Viewer screen.

Example:

In the following example we will look for customers that buy from the manufacturer Lee Jacob Mfg (LJM) in the zip code area beginning with 440 and then display the sales activity for one customer, Adel’s Dist/Cinci.

  1. From the Main dynaMACS screen select the Manufacturer Viewer icon.
    Main Screen
  2. From the Manufacturer Viewer screen highlight the manufacturer Lee Jacob Mfg (code LJM)
  3. Select Open Smart View Locator.Open Smart View Locator
  4. Enter 440 in the Zip Code field in the Locator dialog box.
  5. Select the Locate button.Locator
  6. The Customer Viewer screen will display all customers that buy from Lee Jacob Mfg in the zip code beginning with 440.
  7. Highlight the customer Adel’s Dist/Cinci and right click.
  8. Select Open Sales IQ.Open SIQ
  9. The Sales IQ screen will be displayed showing the sales activity for the customer Adel’s   Dist/Cinci buying from the manufacturer Lee Jacob Mfg.SIQ
  10. From here you can select the Up and Down arrows to see additional customers.SIQ Green Arrows

Tip #1511 – Transferring History to Current Sales Rep

Enhanced Sales Rep Transfer

The Transfer Sales Rep History has been enhanced and moved to the Manufacturer/Customer/Sales Rep Transfer/Combine 1 screen.  In previous versions of dynaMACS selecting the Update History to Current Sales Rep from the Edit>File Transfer/Combine menu would launch the following screen:

Update History Old Screen

In dynaMACS 2015

  1. In dynaMACS 2015 when selecting the Update History to Current Rep from the Edit>File Transfer/Combine menu the following dialog box will now appear.  Select the OK button which will reroute you to the Manufacturer/Customer/Sale Rep Transfer/Combine 1 screen to complete the transfer of sales rep history.

Update History Has Moved


2.  Enter the previous Sales Rep code in the Sales Rep field on the left hand side of the screen.

3. Check the Assigned Rep box.

4. If there are commission splits to be transferred, select the checkbox for Transfer Commission Splits to this Sales Rep?

5.  Select the Proceed  button to complete the transfer.

Transfer Combine Screen with Notes


Tip #1510 – Newly Enhanced Graphing Features in 2015

dynaMACS has made the graphing capability easier than ever.  We have created an instant graph option and a simpler way of placing the graph in other software.  The following outlines the changes to this feature.

Quick Graph

In dynaMACS 2015 you have the option for a Quick Graph which will directly open up a graph based on the selections in the Sales IQ screen.  This is now the default for the Graph button.

  1.  From the Sales IQ screen, click on the Graph button or the Down Arrow next to the Graph button and then select Quick Graph.
  2. The Graph screen will appear displaying the information based on the selections that were made in the Sales IQ screen.Graph Screen with Note

Graph

You can also use the regular graphing feature to change column headings and the graph title.

1.  From the Sales IQ screen, click on the Down Arrow next to the Graph button and then select Graph.
Graph Button


2. This feature will display the Select Columns to Graph screen where you can change the default column headings for your graph.

Columns to Graph

Graphs Can Now be Easily Copied to Clipboard

Copying the graph has never been easier.  By selecting the Copy to Clipboard button while in the Graph screen the graph will be copied to the clipboard and you can easily paste it into any document.

Sales IQ Graph - Copy to Clipboard


Tip #1509 – Using dynaMACS’ Sales IQ to compare Sales and Agency commission for 3 months

This tip will demonstrate a quick way to view and compare your individual monthly sales and agency commission numbers for 3 consecutive months by using the dynaMACS Sales IQ feature.

Example:

In the following example we will show the last three months of sales and agency commission data for all manufacturers as of September 2015.

  1.  With the Manufacturers tab selected in the Sales IQ screen, select Sales + AgyComm (3 Mos) from the Data drop down list.
  2. Select September 2015 in the As-of drop down list.
    SIQ Screen 1
  3. The first three columns display sales and commission data for July 2015.
  4. The second three columns display sales and commission data for August 2015.
  5. The third three columns display sales and commission data for September 2015.
    SIQ Screen 2

Tip #1508 – Did you know about this Simple Way to Get Quarterly Sales Numbers in dynaMACS?

This tip will demonstrate a very simple and quick way to get your quarterly sales numbers by using the dynaMACS Sales IQ feature.

In the following example we will show the last three months of sales data for all manufacturers.

  1.  With the Manufacturers tab selected in the Sales IQ screen, choose 3 Months in the Current Period (CP) drop down list in the Parameters section.
  2. Select September 2015 in the As-of drop down list.
  3. The first column now displays data for the selected 3 month period of Jul-Sep 15 (current year).
  4. The second column displays data for the selected 3 month period of Jul-Sep 14 (prior year).SIQ Screen

Note