Posts

Why Do Reps Need Analytics?

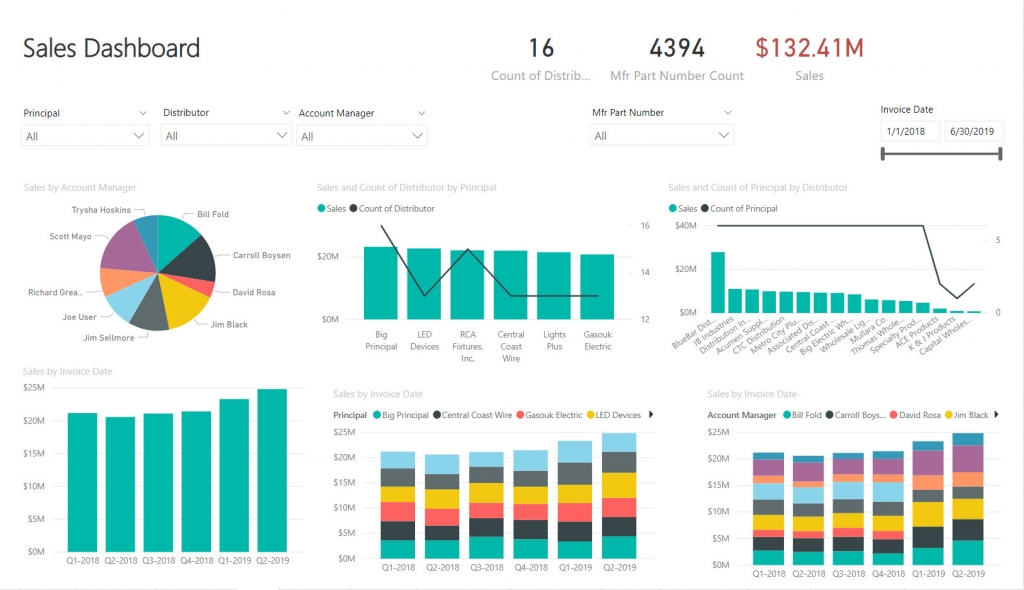
You’re probably using CRM. Hopefully, it’s CRM for manufacturers reps, so it’s easy to use and works how you work.  Your people are updating opportunities, your managing your commissions but what now? What do you do with all the data you’ve accumulated?  How can you use it to show your manufacturers what you’ve sold right down to the product level and what’s in the pipe?  Analytics will do all that and more. Take all your data and easily run visual reports showing trends and drop-offs, what products are doing well and who from your firm is selling the most. Techopedia explains Sales Analytics as “the process used to identify, model, understand and predict sales trends and sales results while helping in the understanding of these trends and finding improvement points. … Relevant data is mined and then analyzed in order to forecast future sales.” Learn more from Techopedia here. Sounds good right – but who has the time? Empowering Systems has taken the work out of analytics. As an add-on to AccountManager CRM Empowering Systems developed AccountReporter Analytics with pre-configured dashboards and filtering so you can skip over the work and start learning about your business trends right out of the box. 
Want to learn more – Contact April, aslepian@empoweringsystems.com or 800-321-1788 Ext. 720

Tip #1711 – Import your Sales Goals Quickly with the dynaMACS Optional Module – eSi

Save hours of manual entry by exporting your sales data out of Sales IQ, manipulate the annual number and simply import your sales goals for the next year back into dynaMACS.

Export your sales numbers out of Sales IQ

  1. From the Sales IQ screen enter in a sales rep that you would like to create goals for.
  2. Select the GlobalView Tab.
  3. Select ALL from the Selector drop-down list.
  4. Wait for dynaMACS to process your request.
  5. Select the Export button.
  6. Name the file and place it in a directory that you will remember where it is located.
  7. Exit out of Sales IQ.
  8. Find the file that you just saved. Double click on it and the file will open in Excel.
  9. Insert a column next to the Sales Jan-Dec 17 column (F) and name it Goals.
  10. Create the formula with the percent that you would like to change. (Example shows 15%).
  11. Copy the formula down the spreadsheet and save it as a csv file.
  12. Go into the eSi reformat screen for dynaMACS.
  13. Map the Goals.
  14. Process through the rest of the eSi steps.
  15. NOTE: Make sure that you are posting the session to January of the year that you want the goals to go into. (Example:  01/2018)

Tip #1709 – Using dynaMACS’ Sales IQ Graph to Show the difference in “House” Commission percentages for this year versus last year

In our previous tip #1708 we talked about using dynaMACS’ Sales IQ to analyze “House” commission. The following will show you how to create a graph from that information.

Using the Graphing Feature in dynaMACS

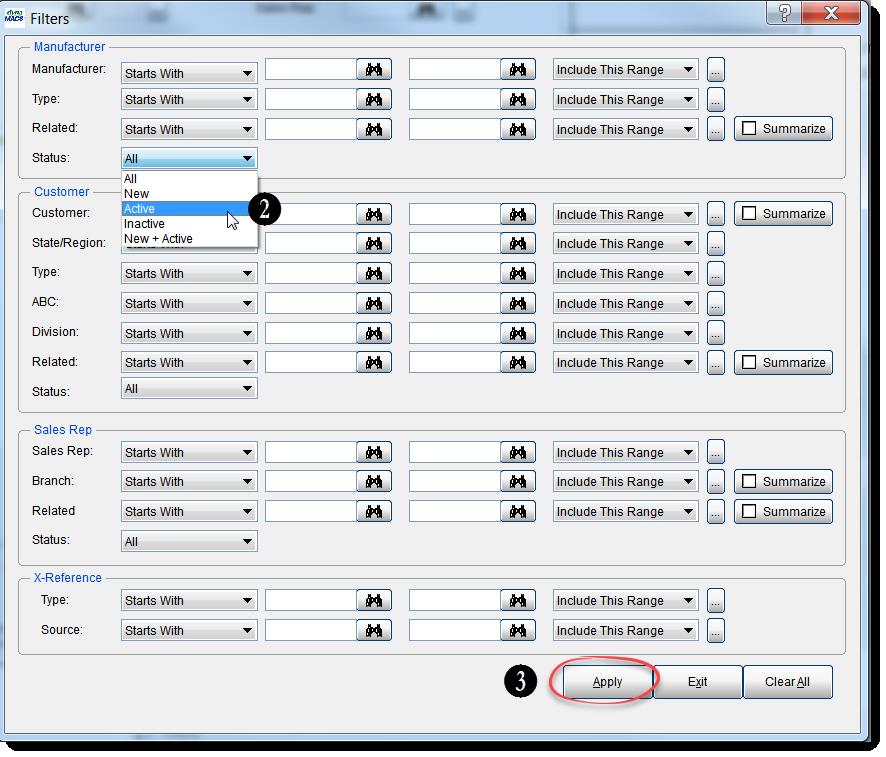
  1.  From the Sales IQ screen select the Filter button.
  2.  Select Active from the Manufacturer Status drop down list.
  3.  Select the Apply button.
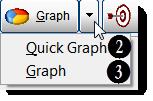
  4. From the Sales IQ screen with your selections displayed, click on the down arrow to the right of the Graph button and select Graph.
  5. Check the boxes for Jan-Aug 19 and Jan-Aug 18 in the Select Columns to Graph screen.
  6. Once you have made your selections click on the Graph button in the lower left hand corner of the screen.
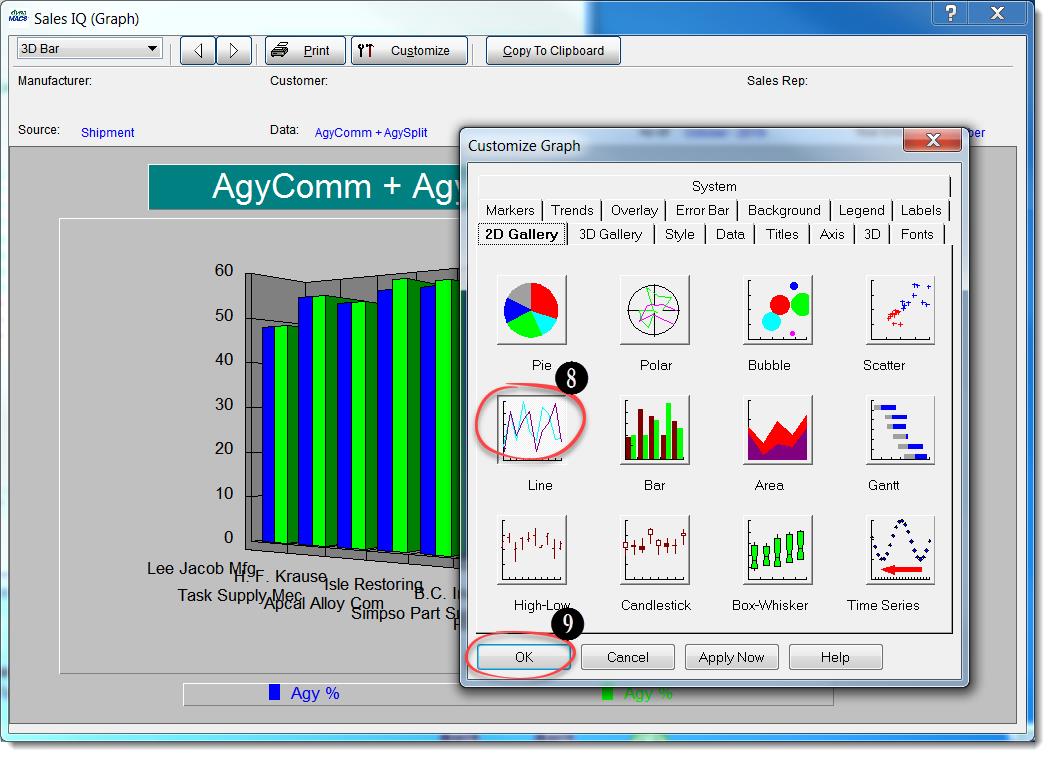
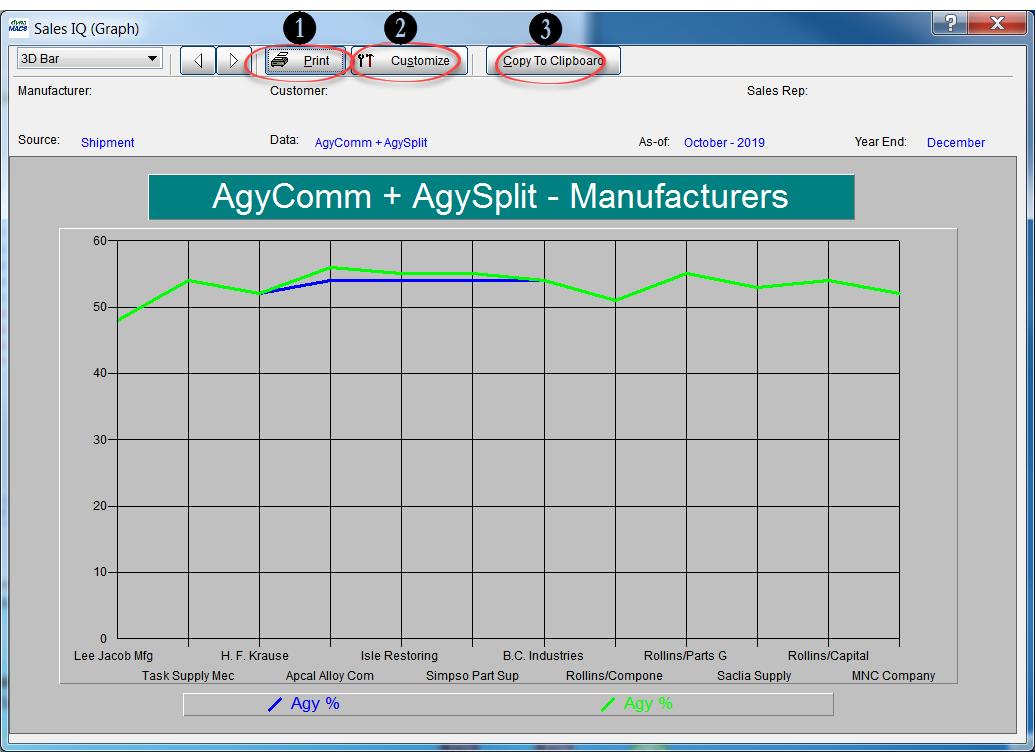
  7. The graph will default to a bar chart.  Select the Customize button to change the type of graph that will appear.
  8. Select the Line chart (or Pie etc.) to customize the look of your graph.
  9. When you have completed your selections select the OK button.

From the Sales IQ Graph screen you can:

  1.  Print the graph.
  2. Customize the look of the graph.
  3. Copy to Clipboard.

Tip #1706 – Are you constantly changing the “display by” search in the customer viewer?

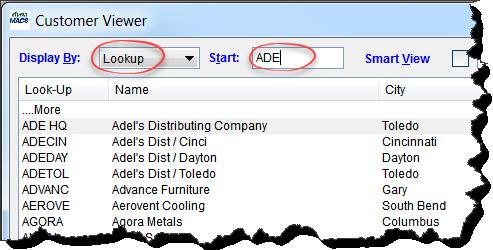
The Display By field in the dynaMACS Viewer screens defaults to “Lookup” which lets you enter the first few characters of the Name i.e. manufacturer, customer or sales rep name in the Start field which will display a list based on that entry.

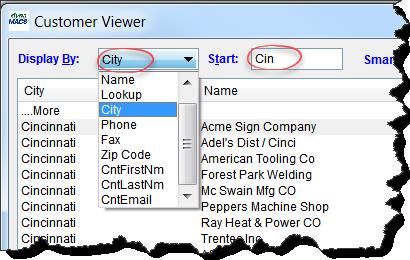
You can change this default temporarily by selecting the down arrow in the Display By field while in the Viewer screen.  This will change the Display By for the current viewing session.

You can also change the default so that every time you access the Viewer screens it will default to your personal selection.

To Change the Default Display By Field for the Viewer Screens

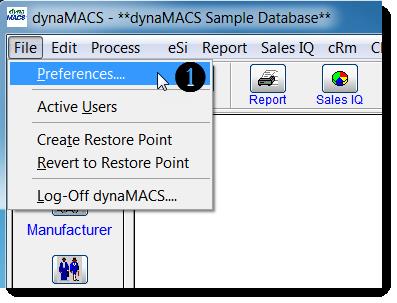
  1.  From the main dynaMACS screen select File>Preferences.

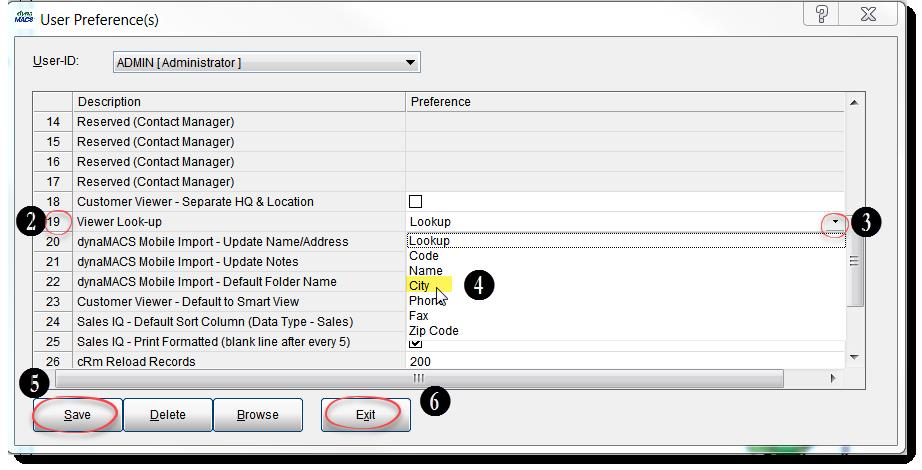
  2. From the User Preference(s) screen, scroll down to #19 Viewer Look-Up.
  3. Select the drop down arrow to the far right of Viewer Look-Up.
  4.  Select the field which you would like your default Viewer Look-Up to be ( i.e. City).
  5. Select the Save button.
  6. Select the Exit button.

Now when you access any of the viewer screens the Display By field will default to that selection.

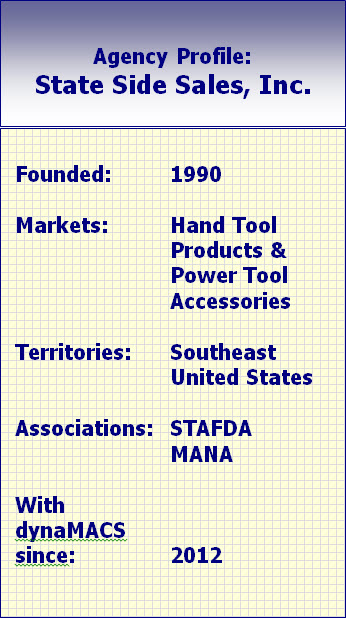
Case Study: State Side Sales

 “dynaMACS uses GoogleMaps to plan efficient routes when we visit multiple customers. We spend less time in the car and more time selling.”

Joe Durbin, President
State Side Sales, Inc.

Client Challenge

State Side Sales Agency was using rudimentary sales and commission software that didn’t provide enough useful information to meet their needs. The agency chose dynaMACS and instantly had a wealth of meaningful data to analyze performance, track trends and operate proactively. As the years passed, the agency became accustomed to having all the sales and commission information they needed at their fingertips. When State Side Sales stopped using dynaMACS and tried to get by with different software, they missed many of dynaMACS’ features.


dynaMACS Solution

Joe Durbin, President of State Side Sales, read an article on LinkedIn about dynaMACS’ ability to map routes when visiting multiple customers, and he saw an opportunity to improve his agency’s efficiency. “We were already missing our favorite dynaMACS features. When I saw the GoogleMaps function, I knew it was time to go back to dynaMACS. We now spend less time in the car and more time selling and building relationships.”

While looking at the sales numbers, reps select the customer addresses that they want to visit. A map view of all locations is displayed, along with the most efficient routes and directions between locations. Sales reps can also re-sequence the route if they choose. “We’re increasing efficiency, reducing travel time and maximizing reps’ time.”

The agency also has the ability to select a territory and see performance data for the top 20% of manufacturer/customer relationships (using sales volume). “We use this as a performance indicator and we see trends faster. It’s another level of knowledge that we didn’t have without dynaMACS.”

dynaMACS continually adds new functionality, and the support team is on hand to show State Side Sales tips and tricks for extracting detailed information organized in meaningful ways, with just a few mouse clicks.

Tip #1705 – dynaMACS Helps Agencies get Sales & Commission Information Electronically with this Manufacturer Benefits White Paper

Electronic Sales Information (eSi) is the electronic distribution of sales information from manufacturer to sales agencies. The dynaMACS eSi module can replace hours of data entry with a quick and easy process of automatically importing sales information from manufacturers that email their sales information in a spreadsheet format.

The move to dynaMACS eSi requires a simple change in an administrative process on the part of the manufacturer.  Instead of paper reports, the manufacturer produces a spreadsheet that contains the same information and sends it via email to sales agencies. The manufacturer buys no special software, no additional hardware and actually saves money by reducing paper, postage and administrative support costs. The agency receives the information on the same day the manufacturer sends it. The agency can then process the information immediately and if desired, distribute it to sales reps in the field.

The eSi process:

  1.  The agency receives data from the manufacturer via email, CD, or Internet download. No more waiting days or months for data.
  2. Data is provided in a standard comma-delimited (.csv) format or spreadsheet, for automatic upload to the agency database. Data entry is eliminated and so are operator errors.
  3. The agency processes the file to identify new or first-time customers and to balance total sales and commission amounts. Files are updated using dynaMACS’ easy on-screen error correction and new customer lookup capabilities. Your manufacturer customer codes are automatically matched to dynaMACS codes.

It is literally that easy. Giving you instant access to vital sales analysis and commission information, dynaMACS is a fast, flexible and reliable way of managing sales and commission data.

Click Here to view the white paper


If you do not currently have dynaMACS eSi and would like more information about it, please visit www.dynamacs.com/products/esi.shtml or call us at 800-321-1788.